I am currently open to remote software development opportunities. See my resume and cover letter.
Portfolio
About Me
I have been writing software for over 20 years. I have over 10 years of experience developing large-scale, distributed processing systems in the field of Electronic Discovery (eDiscovery). After taking a break from eDiscovery software to pursue my own projects (examples below), I am now looking to find a company where I can make a major impact solving problems again.
Learn more my experience at My Professional Background.
Professional Highlights
- Conceived, designed, wrote, and tested an eDiscovery software solution (Minify) written in .NET, consisting of over 200,000 lines of code.
- The success of Minify led to the formation of Minify, LLC to market its two main products: Minify Data, a client/server desktop eDiscovery processing application, and Minify Discovery, a web-based eDiscovery review platform.
- Designed a database architecture with over 100 tables and query optimization for high scalability.
- Managed an IT Staff, including hiring, firing, training, and performance reviews.
- Senior software engineer for the leading eDiscovery software company, Relativity.
- At my first company, IKON, I was promoted 5 times in 5 years.
- At my second company, Digital Legal Services (DLS), within one year, I wrote eDiscovery processing software (Minify Data) that saved $200,000 in annual licensing costs.
- At my third company, Relativity, I was the all-time highest scorer on the Relativity Certified Administrator Exam (RCA), a requirement for all employees.
- At Relativity in 2014, I was the only new engineer to lead a development team, a team created specifically for my experience.
Software Projects
These are projects that I’ve worked on over the past several years:
Minify A 200,000 code line eDiscovery processing and review platform that solved many hard problems, saved a ton of money, and spawned a startup software company, Minify, LLC.
Puzzle Boxes A design tool for making physical boxes from 3D drawings using Computer Numerical Control (CNC) cutting machines. Used to create Puzzle Box art.
Puzzle Games A series of four connect-the-dots puzzle games I wrote, available at the Google Play Store. At the heart of the software is a level generator that became so good at creating human-like puzzles that it passed the Turing test.
Computer Generated Line Art Unique computer generated artwork created by the level generator that I wrote for my puzzle games.
Color Grids Another type of computer generated artwork featured on this site, where my program fills in a grid with colors according to a customizable set of rules. Used to solve some mind-bogglingly hard problems.
The Solution to Darts? For Part 1 of this project, I demonstrate a mathematical solution to several target optimization problems of increasing complexity for the game of darts. For Part 2, I tracked over 30,000 of my dart throws to test my solution and adapted it for an actual human darts player. Possibly my favorite project because it is about a problem that I did not quit thinking about until it was solved.
Minify
Main Page: Minify


Minify is an eDiscovery solution that I wrote over a period of five years while working for Digital Legal Services, and later Minify LLC, the company that was started to market and sell this software.
In addition to writing the software, I also designed and wrote the above product sheets for the two main products that we were selling: Minify Data, a client/server desktop eDiscovery processing application, and Minify Discovery, a web-based eDiscovery review platform.
I also designed Minify’s database architecture, and created the following database diagram for Minify Discovery (originally named idsImpulse):

For more details of Minify’s extensive functionality, view the full product sheets: Minify
Puzzle Boxes
Main Page: Puzzle Boxes
The software is explained in detail at Puzzle Boxes: The Software


This software is a design tool for making boxes using Computer Numeric Control (CNC) cutting machines. As input, it takes industry standard AutoCAD drawings, and as output it produces files that can be used to precision cut wood, plastics, and other materials for the creation of physical boxes. The sides of the boxes fit together like the pieces of a puzzle using finger joints, an assembly process common to woodworking.
Making Box Designs from Shapes
The first step in this process is to convert 3D models of arbitrary shapes (called bounding volumes) into box designs, which are assemblies of rectangular prisms. Below are examples of box designs created by the program using a sphere as a bounding volume.

The software can create box designs from more complex bounding volumes with options that control the size, shape and number of sides of the resulting designs:

In addition to box designs automatically created from a bounding volume, the software also supports box designs manually created in AutoCAD (e.g. the Relativity Box) and combination designs that were generated by the software and then manually edited (e.g. the Christmas Tree Box).
Finger Joints
The software can then read the AutoCAD model and extrude the 2D faces into 3D pieces of one or more material thicknesses. The next step of the process is to create finger joints so that the sides of the box will fit together. Depending on whether they are on an inside or outside edge, these fingers can either add or remove material to individual pieces.


Making Boxes
Once finger joints are drawn, the program can then output instructions for a CNC machine to cut out the pieces from a sheet of material. Because these boxes can be complex, consisting of a hundred or more individual pieces, this software outputs numbers and labels for each piece, including piece numbers for each adjacent side that serve as assembly instructions.

The pieces can then be decorated and assembled into a physical box.

Other Uses
Although the demonstrations for this software are small decorative boxes, there are other more practical uses.
- This software can also be used to design custom crating needed to contain unusually shaped cargo.
- This software can be used to design unusually shaped crates designed to be contained in the cargo holds of aircraft and other limited spaces.
- The manual box design of this software can be used for designing custom forms for casting concrete.
- Future revisions of the software are slated to include features for designing furniture, both drawer and door design.
Puzzle Games
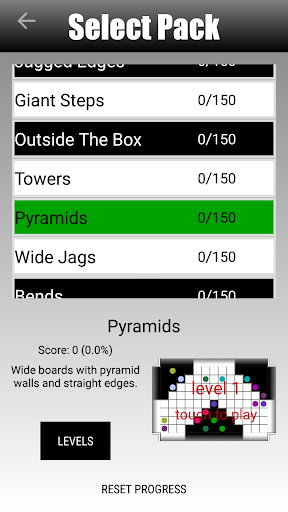
Main page: Games
Over the past few years, I have developed and released a series of connect-the-dot puzzle games, available on Android. Below are links to each game’s Google Play Store listing:
Connect the Dots: Shadows (CTD: Shadows)
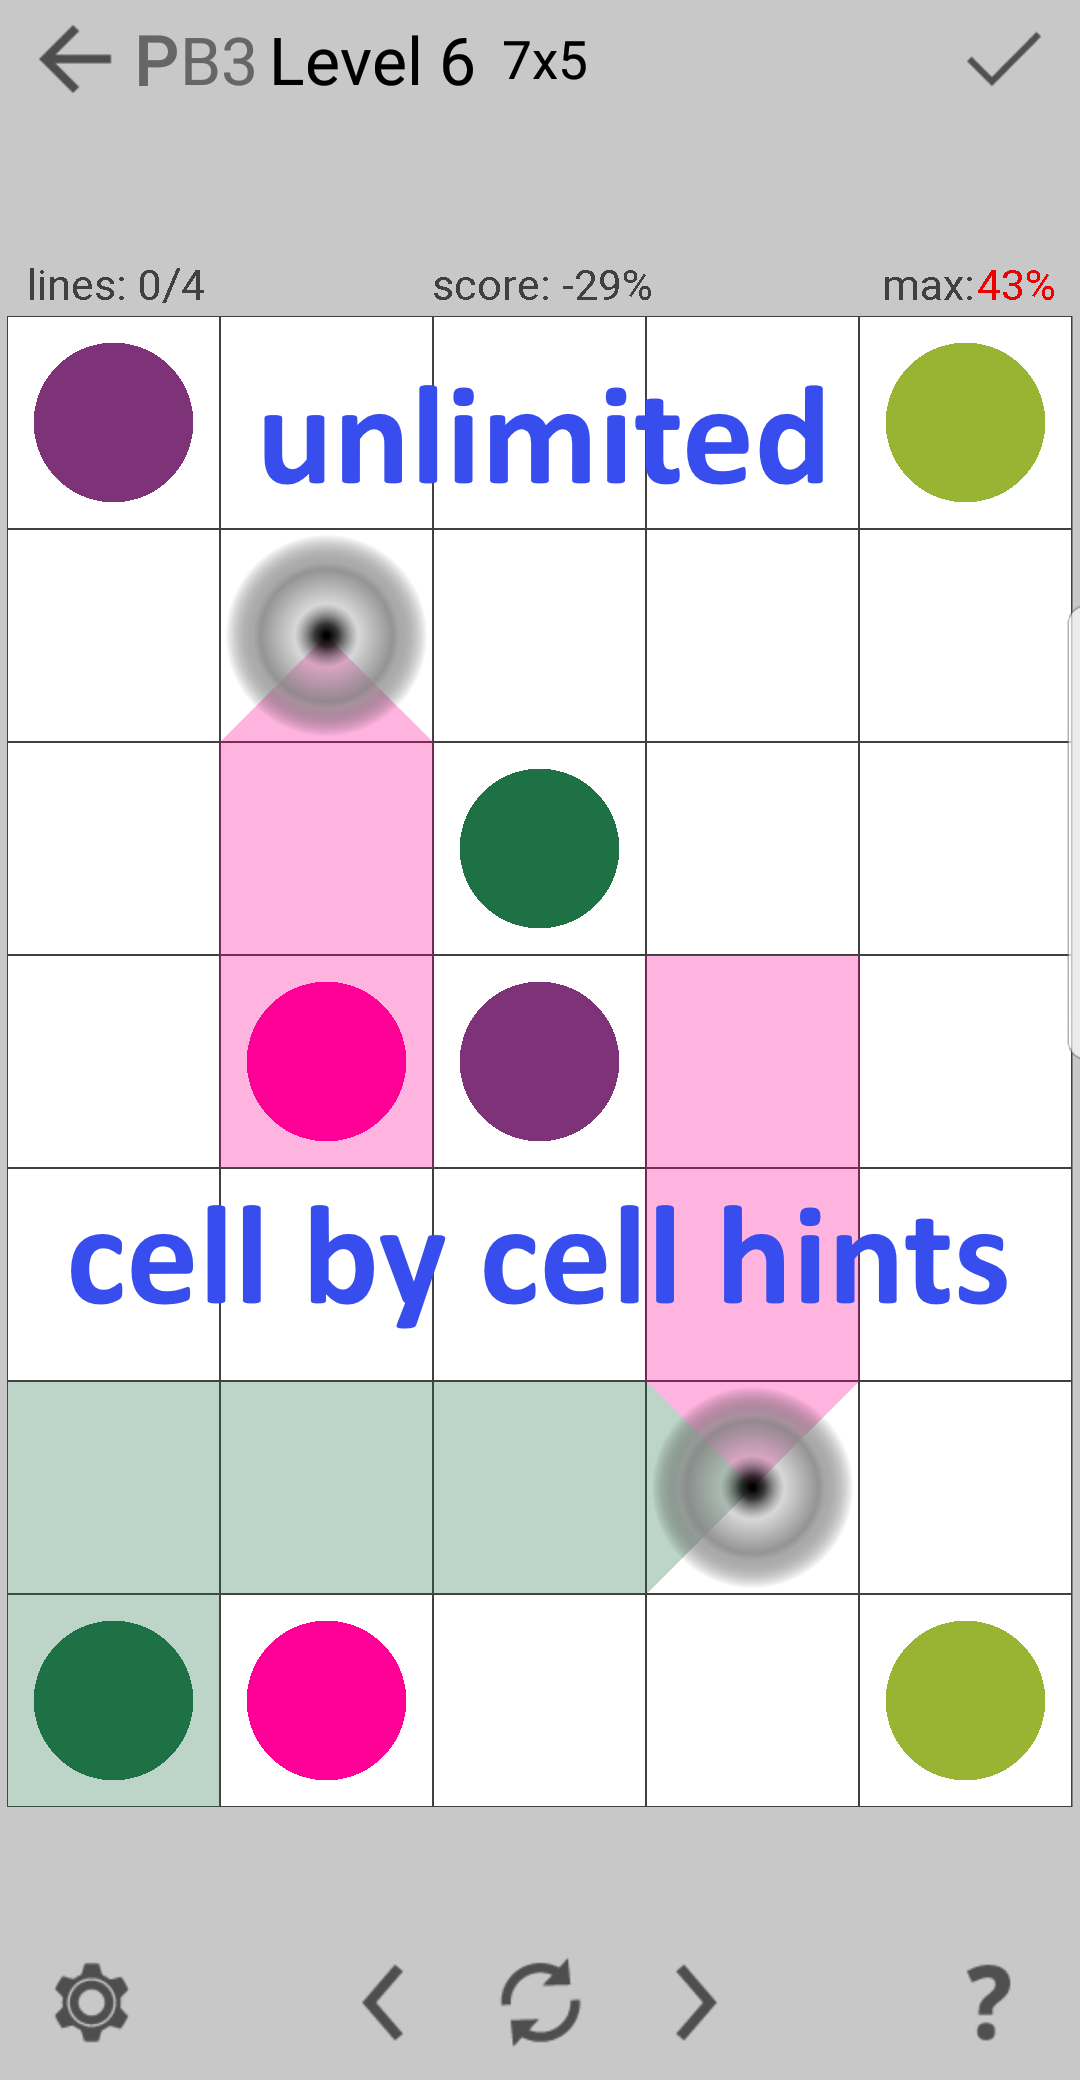
Connect the Dots: Portals (CTD: Portals)
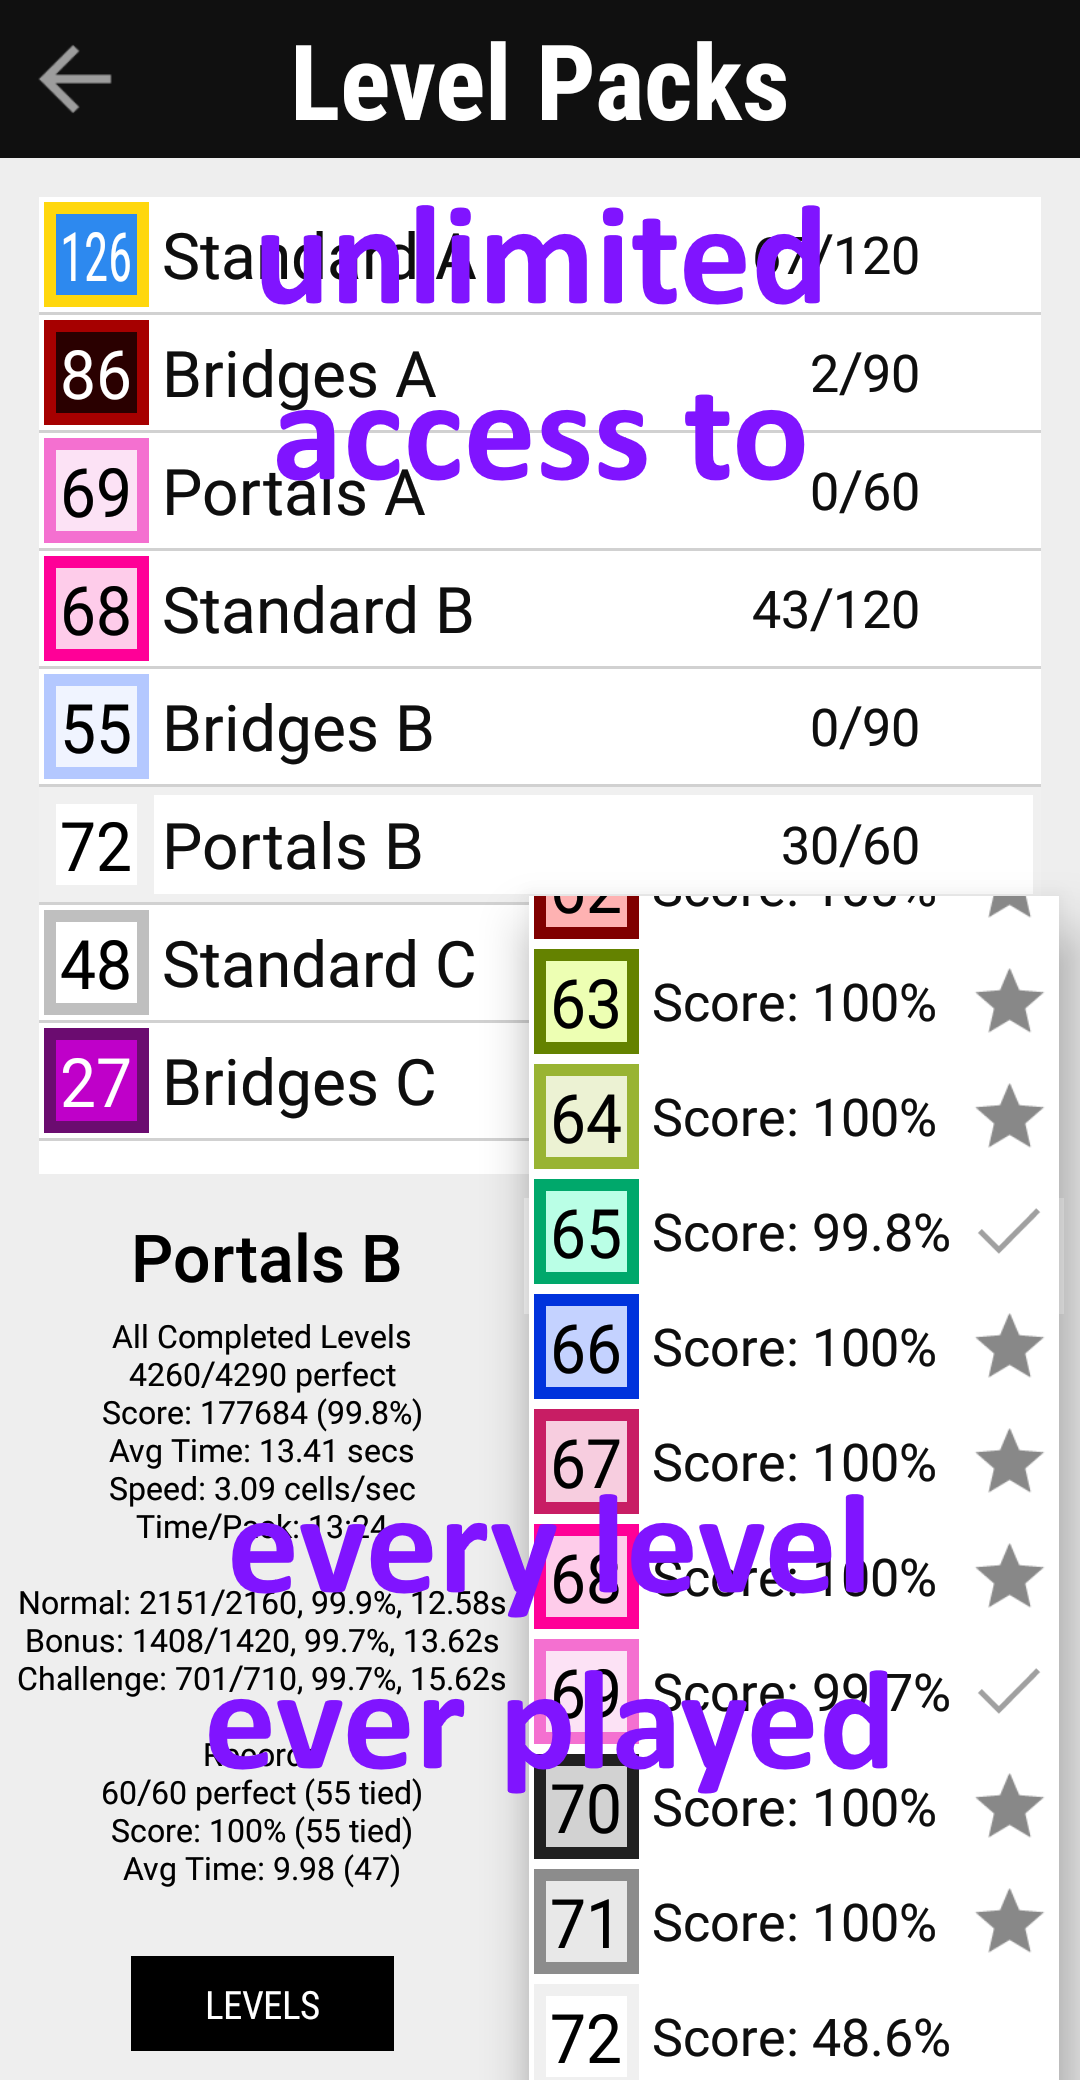
Connect Unlimited 2 (CU2)
The levels in my games are generated by a program that I originally wrote for Connect Unlimited, and revised for each of my next three games. The gallery below shows screenshots from my first three games:

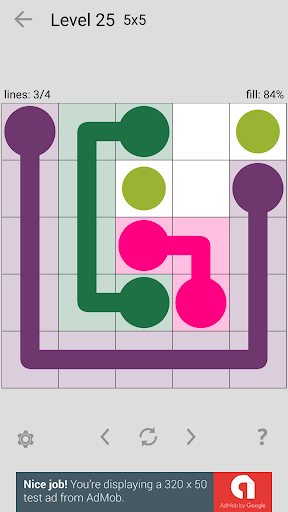
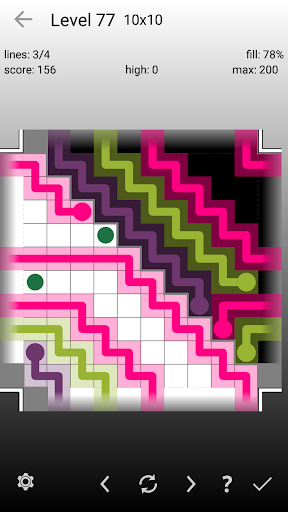

Connect Unlimited 2: Unlimited Quality Puzzles That Don’t Look Computer Generated
Of these, my favorite game is Connect Unlimited 2, which I still play years after completing its development. The gallery below shows screenshots from this game:

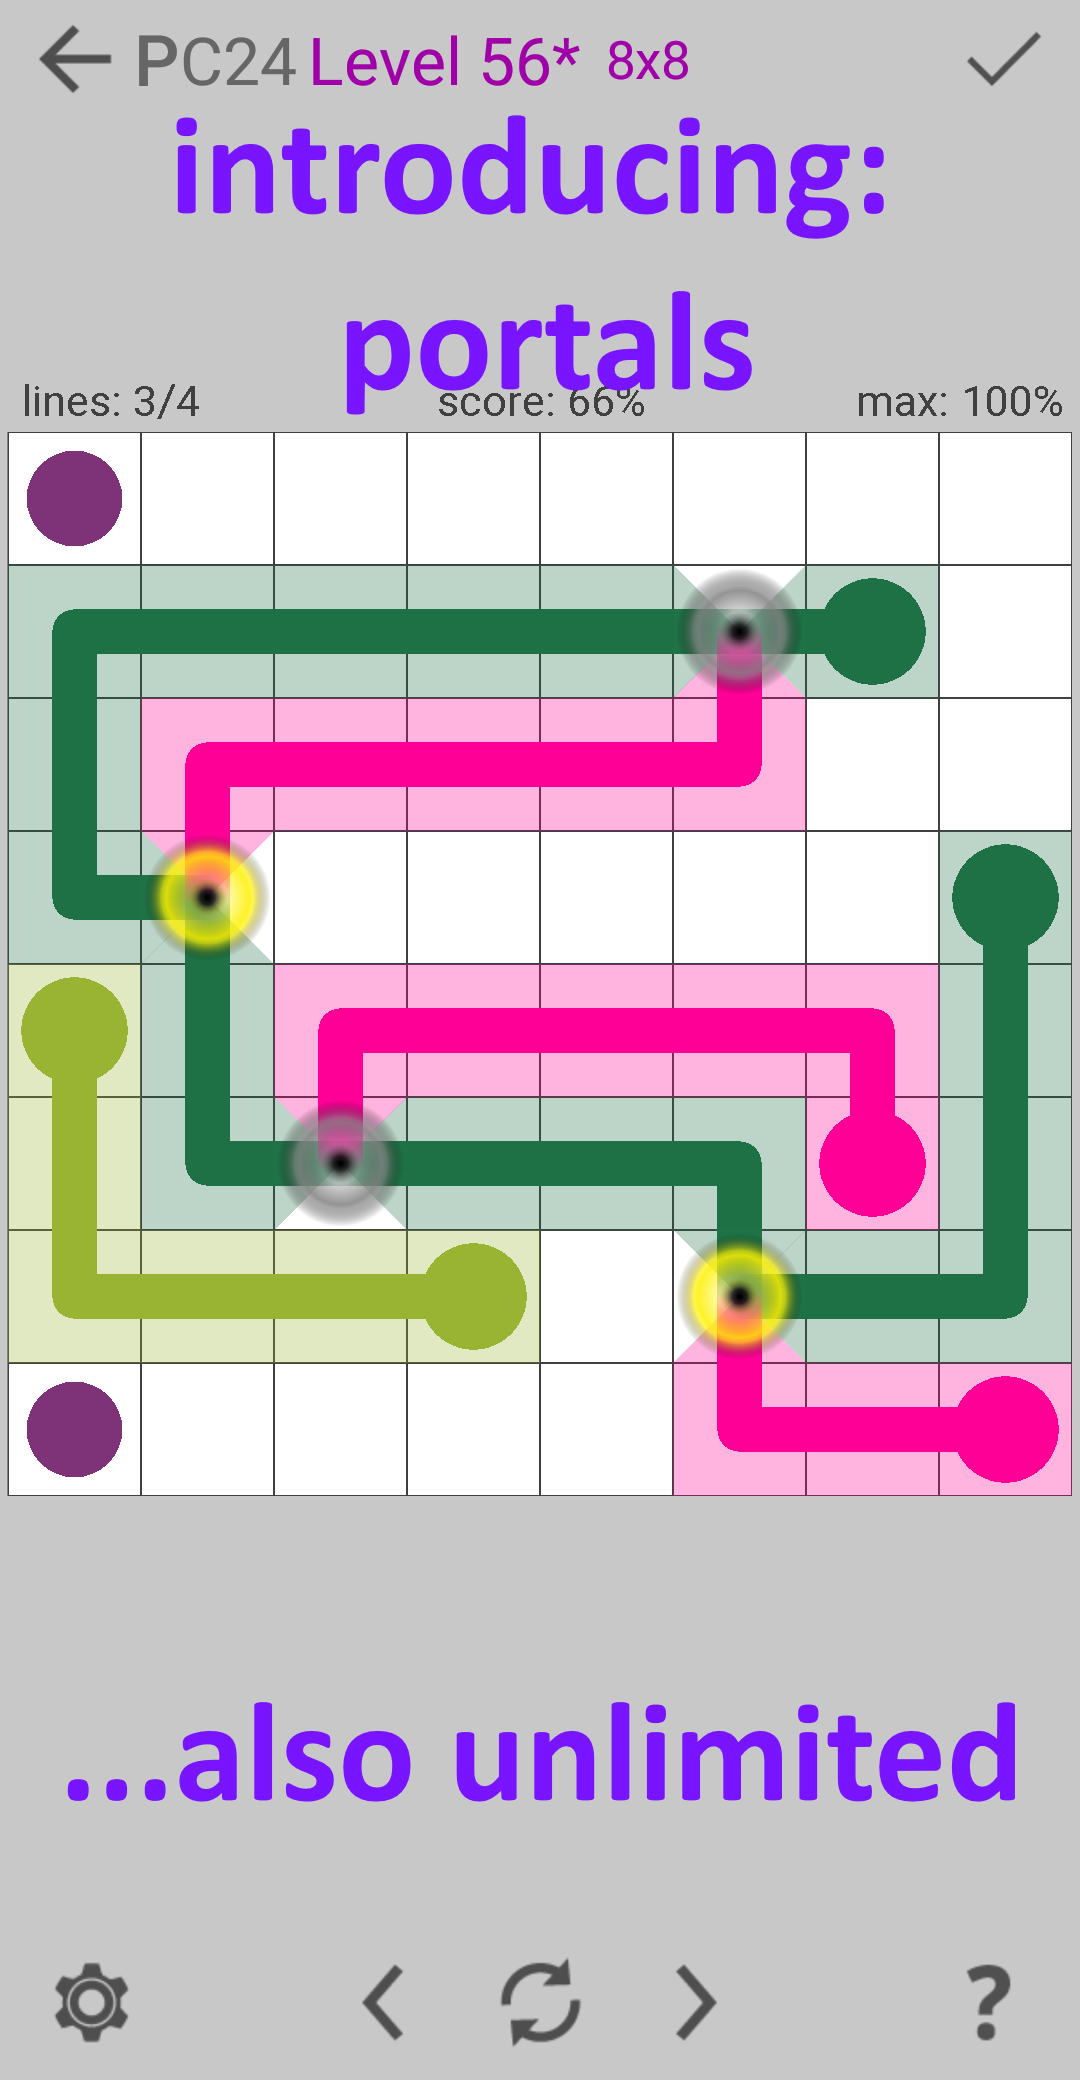
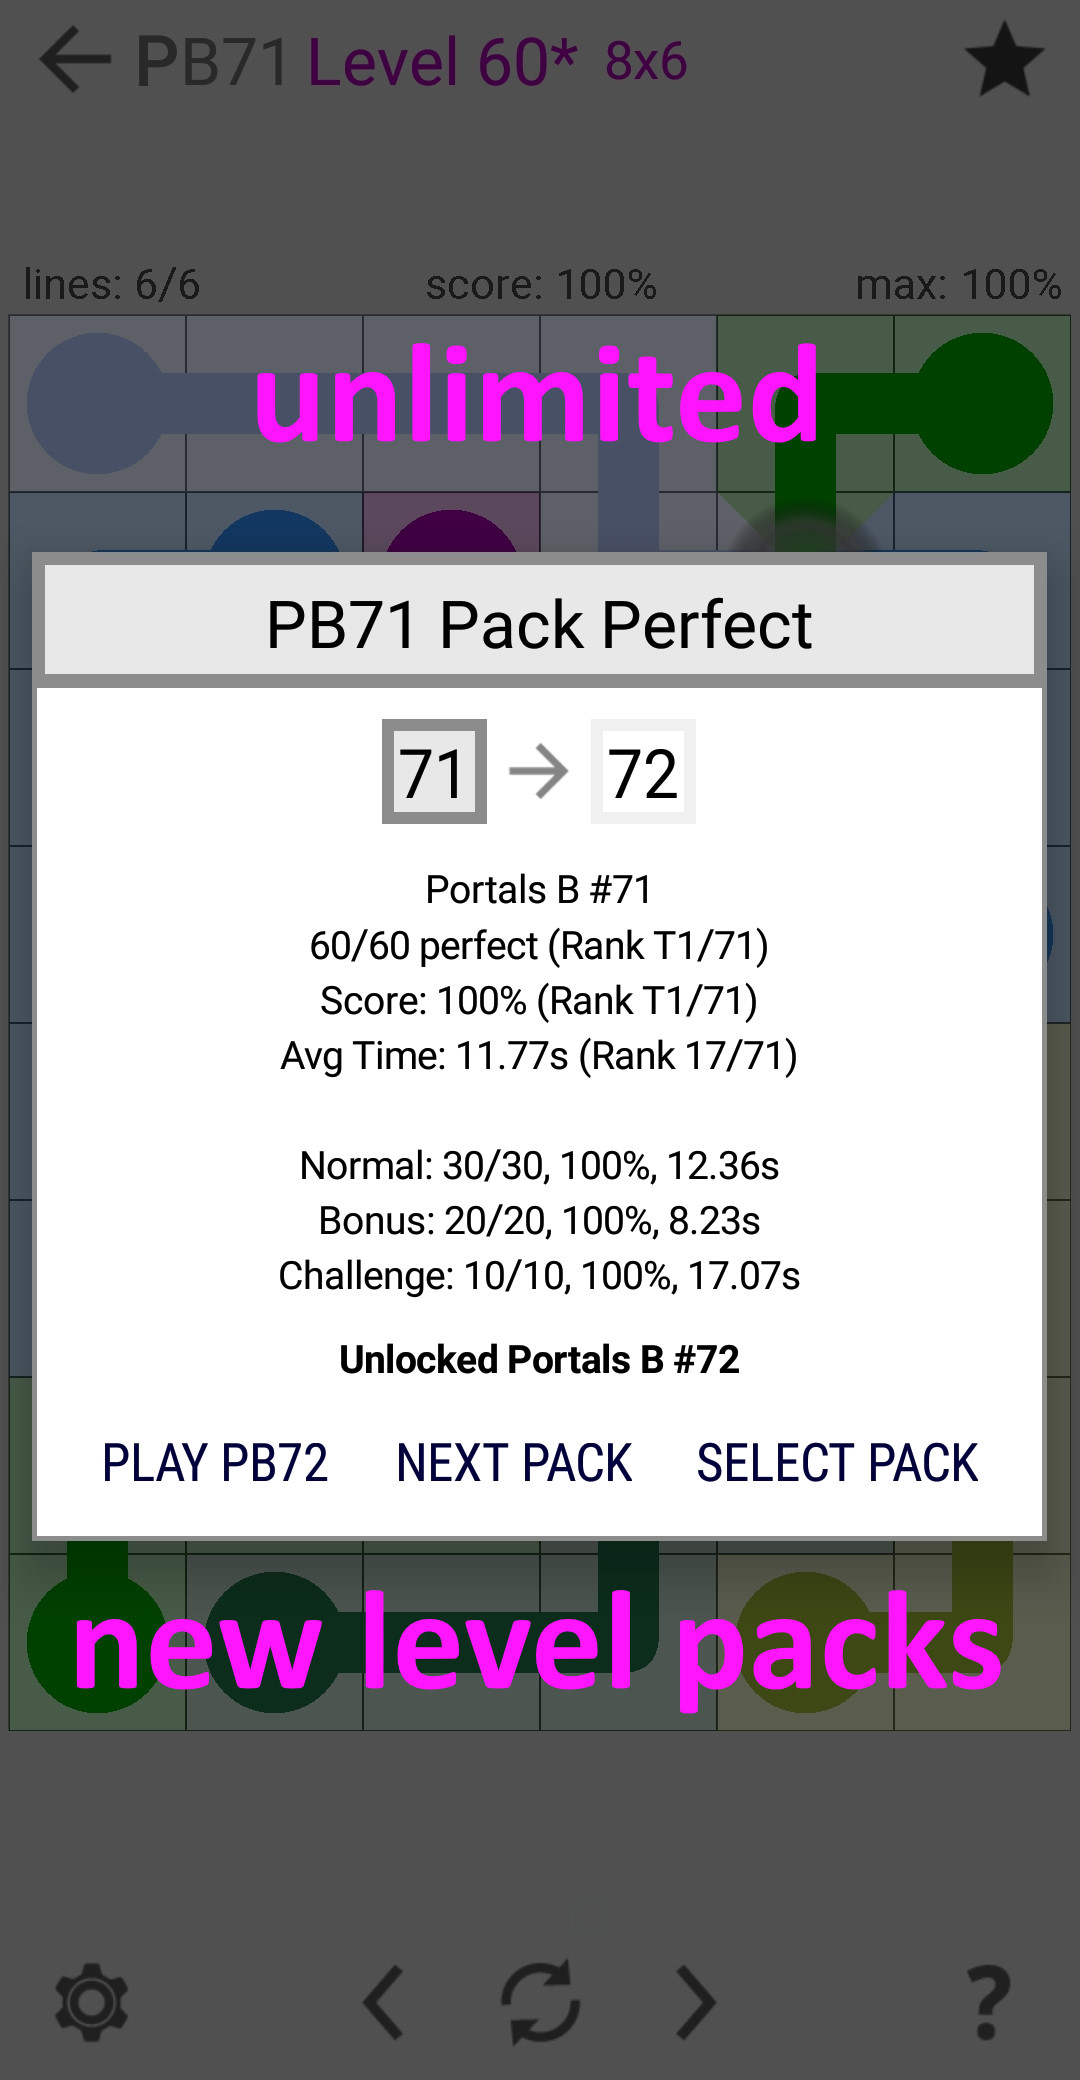
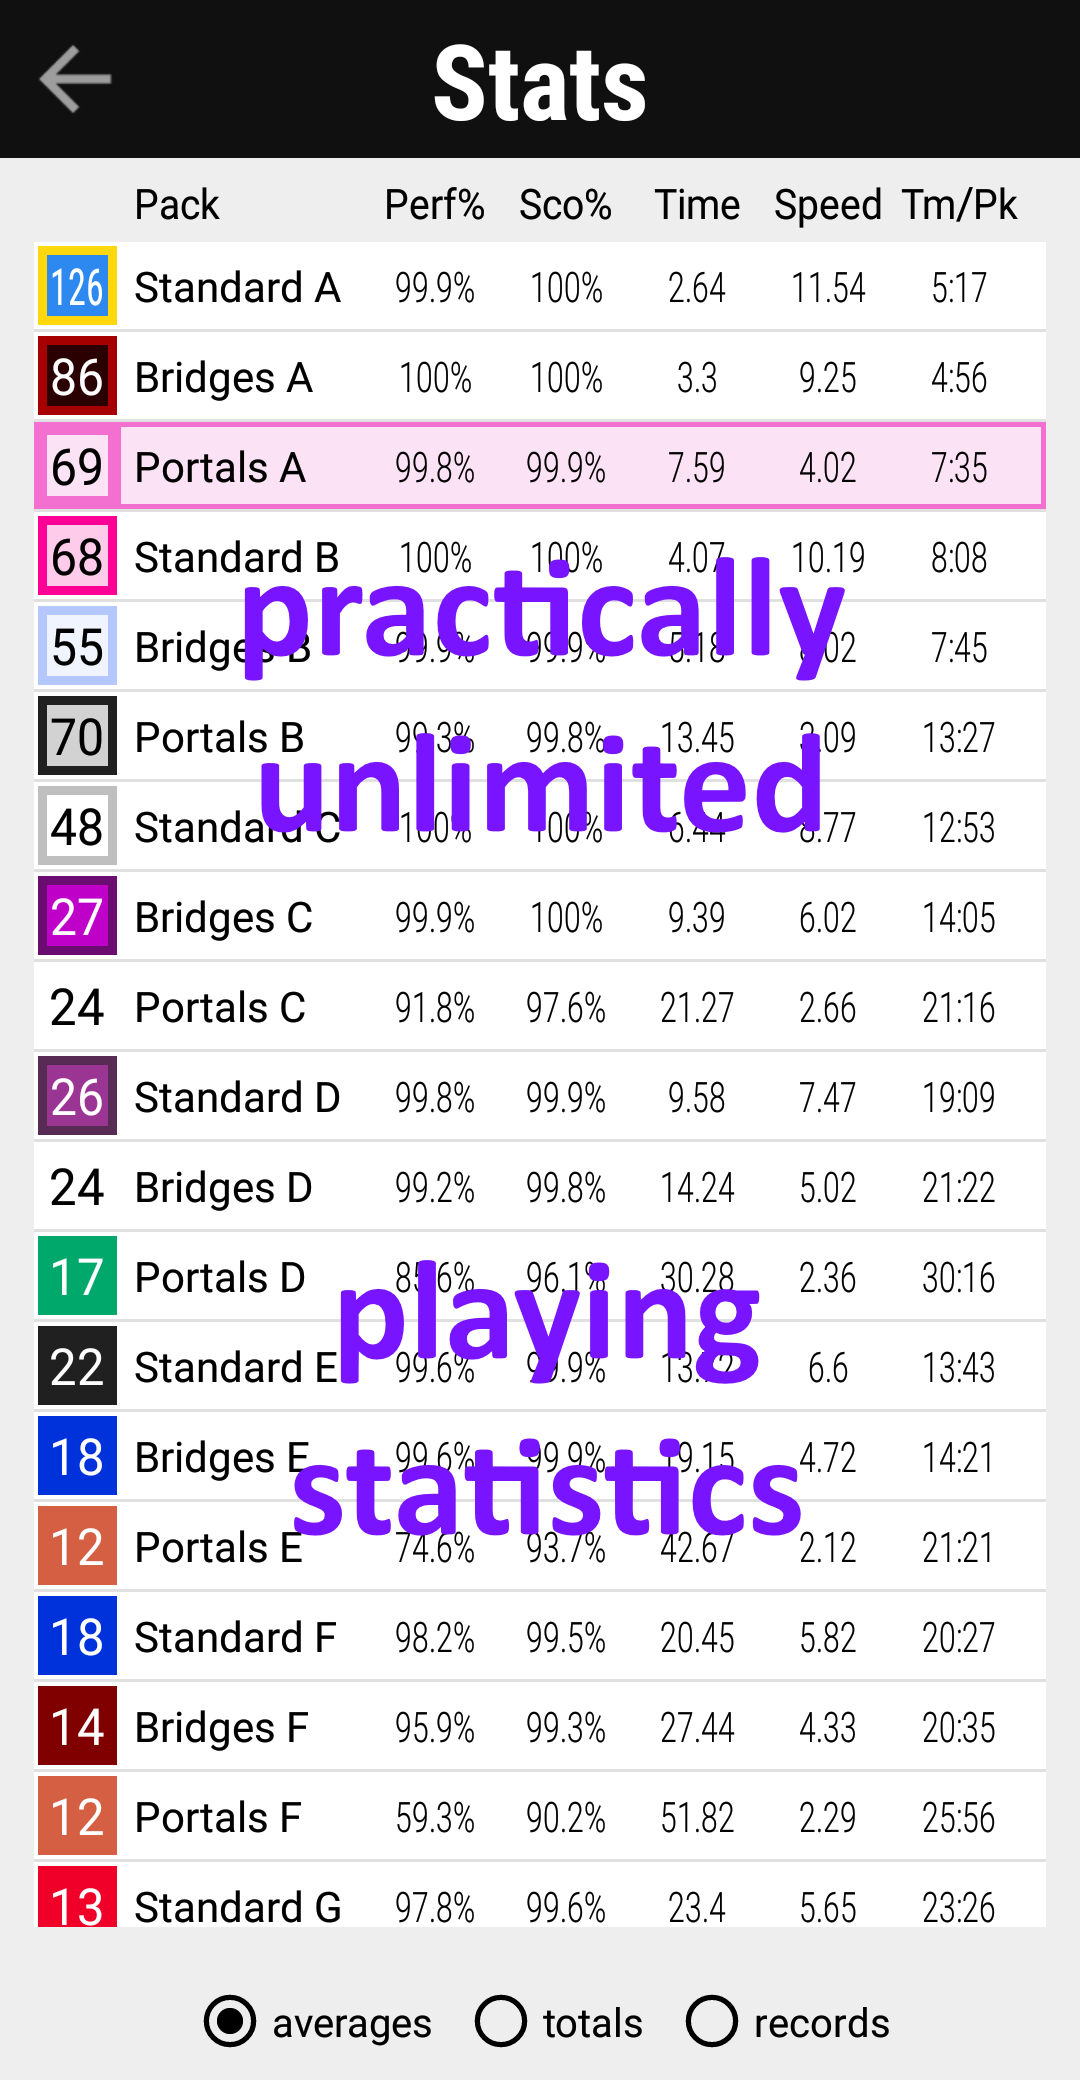
Connect Unlimited 2 includes many features, but my favorite part of the game are the puzzles. The puzzles in Connect Unlimited 2 are simpler than my previous games, a design decision which highlights my level generator’s ability to create interesting levels without complex modifications.
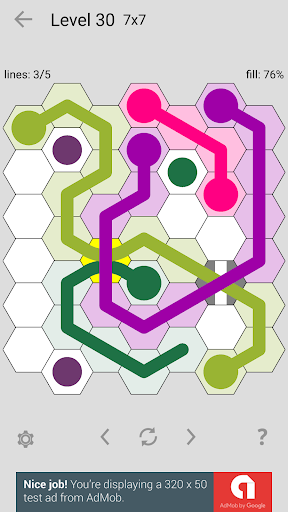
A limitation of my first game, Connect Unlimited, was the tendency for its levels to be repetitive. For the sequel, I developed a process designed to isolate the most unique levels that I call similarity filtering. I also created similarity maps as visual aid to see the results. Below are similarity maps for four randomly selected 7×7 levels from the original Connect Unlimited.

Each cell has a similarity score which consists of two components used to generate the background shading, one red and one blue. For these levels the shading is darker for long line segments that follow the edge of the board.
The levels in Connect Unlimited 2 are selected by similarity filtering, with only 1 out of 50 levels making it into the game. For comparison, below are similarity maps for four random 7×7 levels from Connect Unlimited 2:

As shown, similarity filtering is really good at finding levels where the lines don’t simply follow the shape of the board, but form their own distinctive patterns. The resulting levels are significantly more challenging than comparable levels in the original Connect Unlimited, even for lower levels of the games.
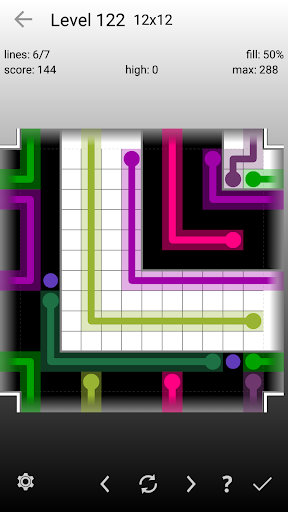
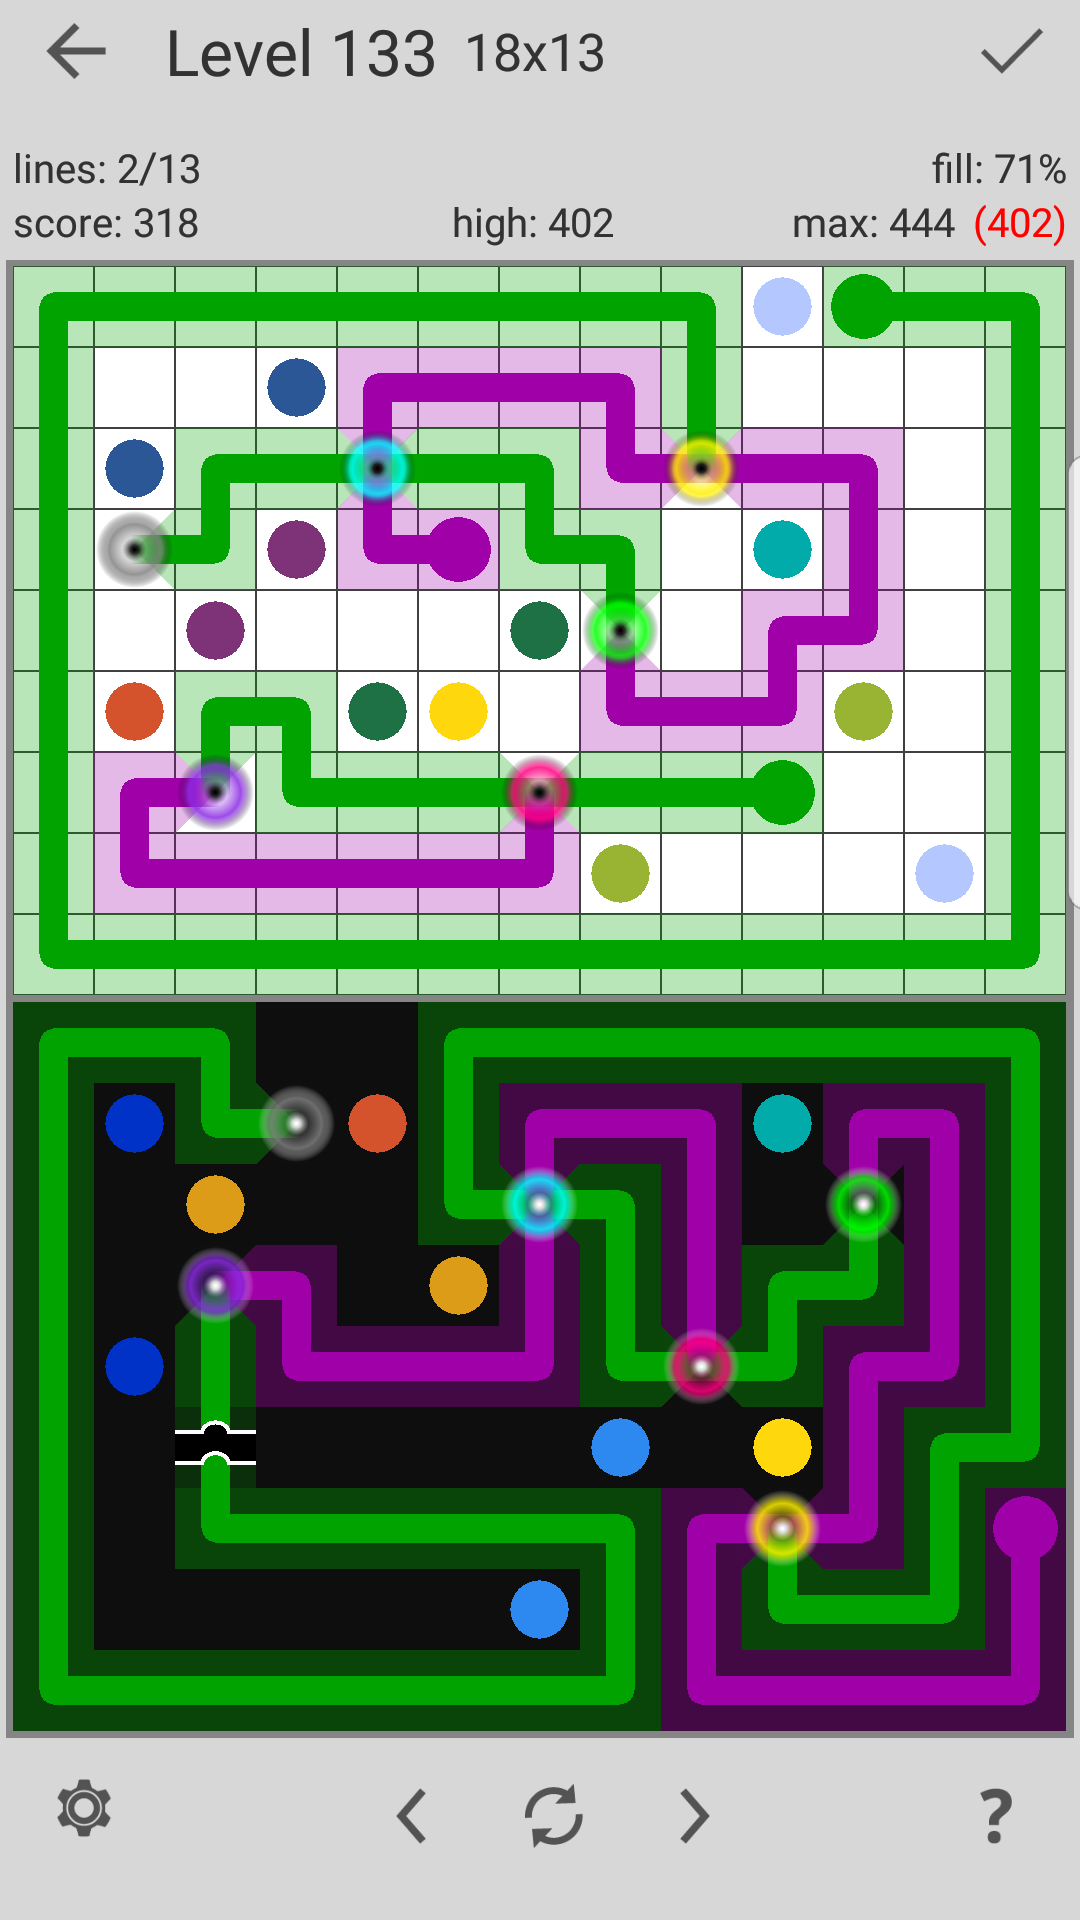
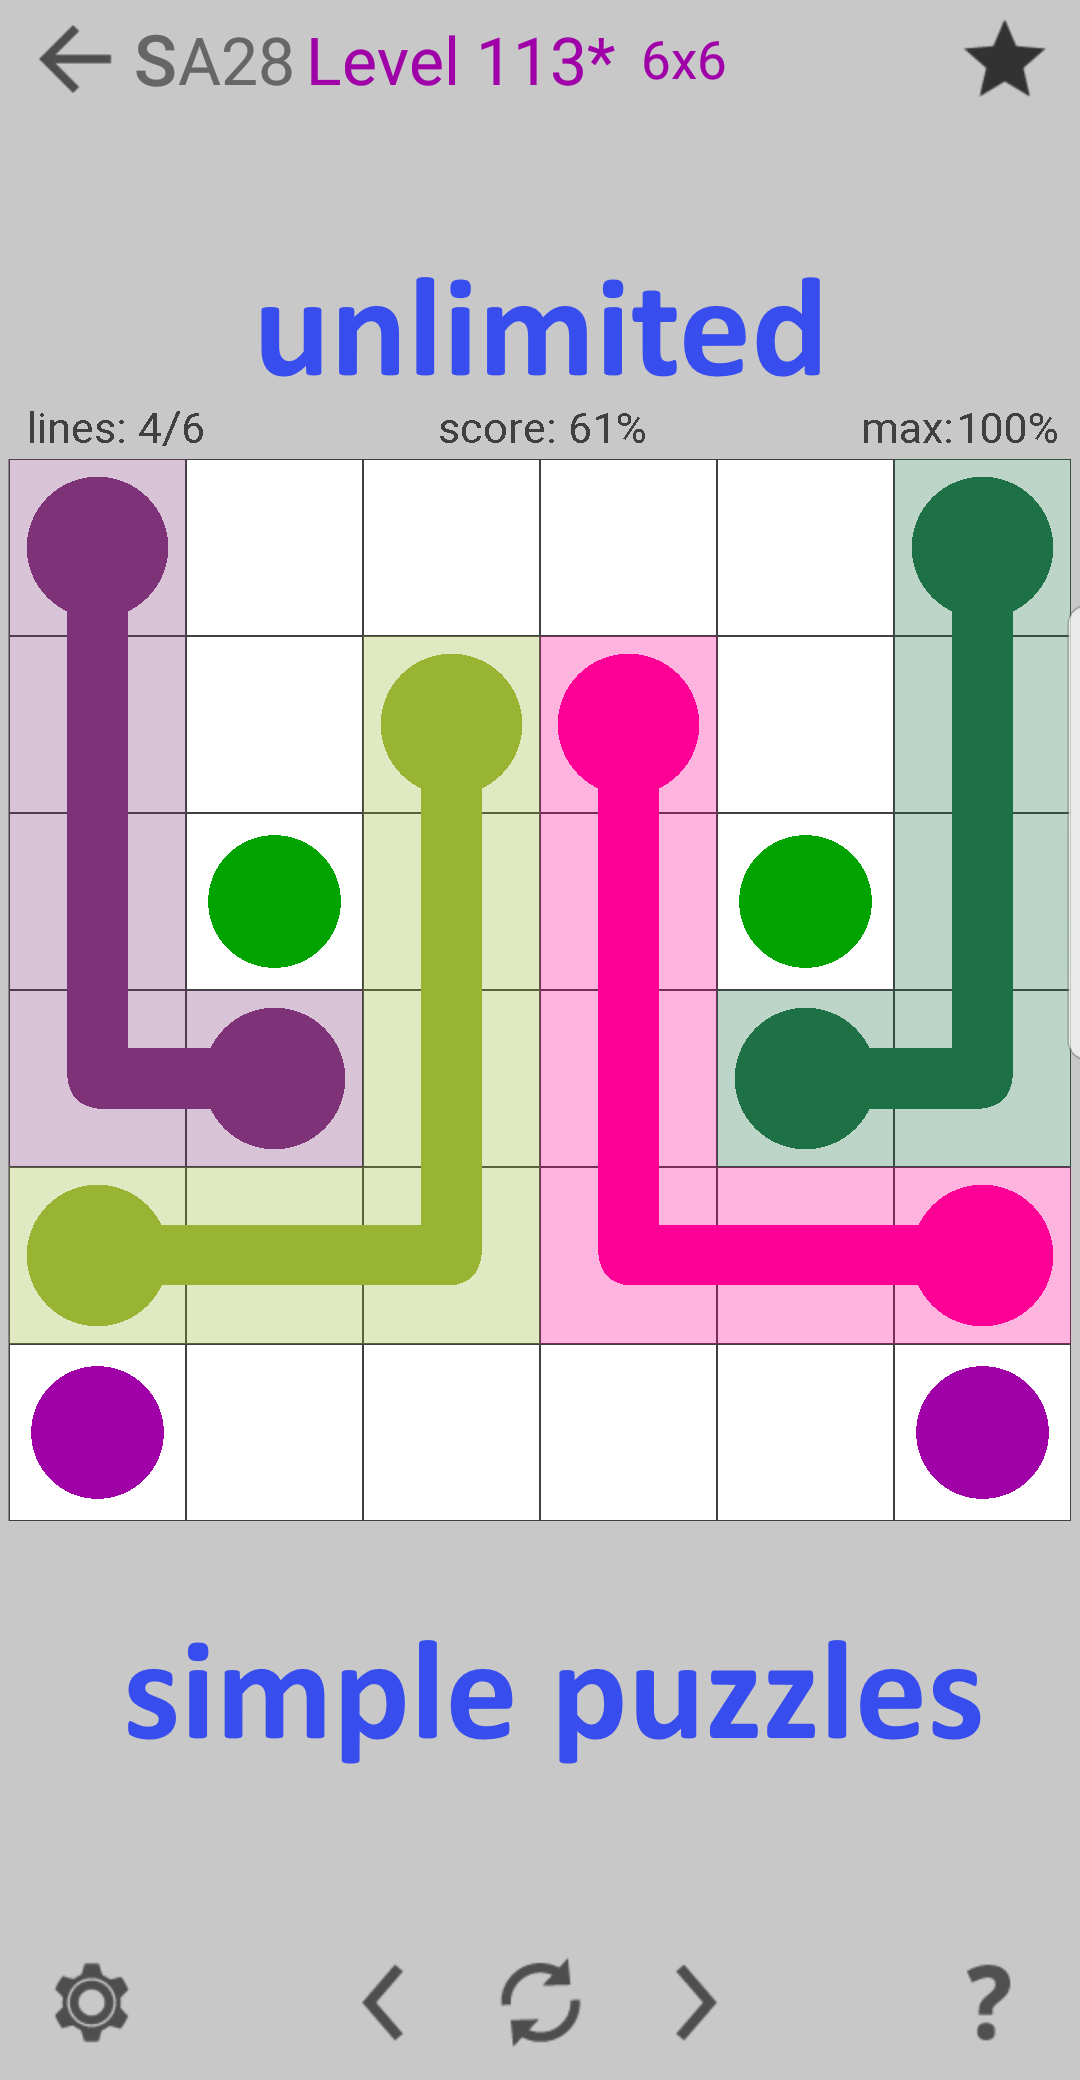
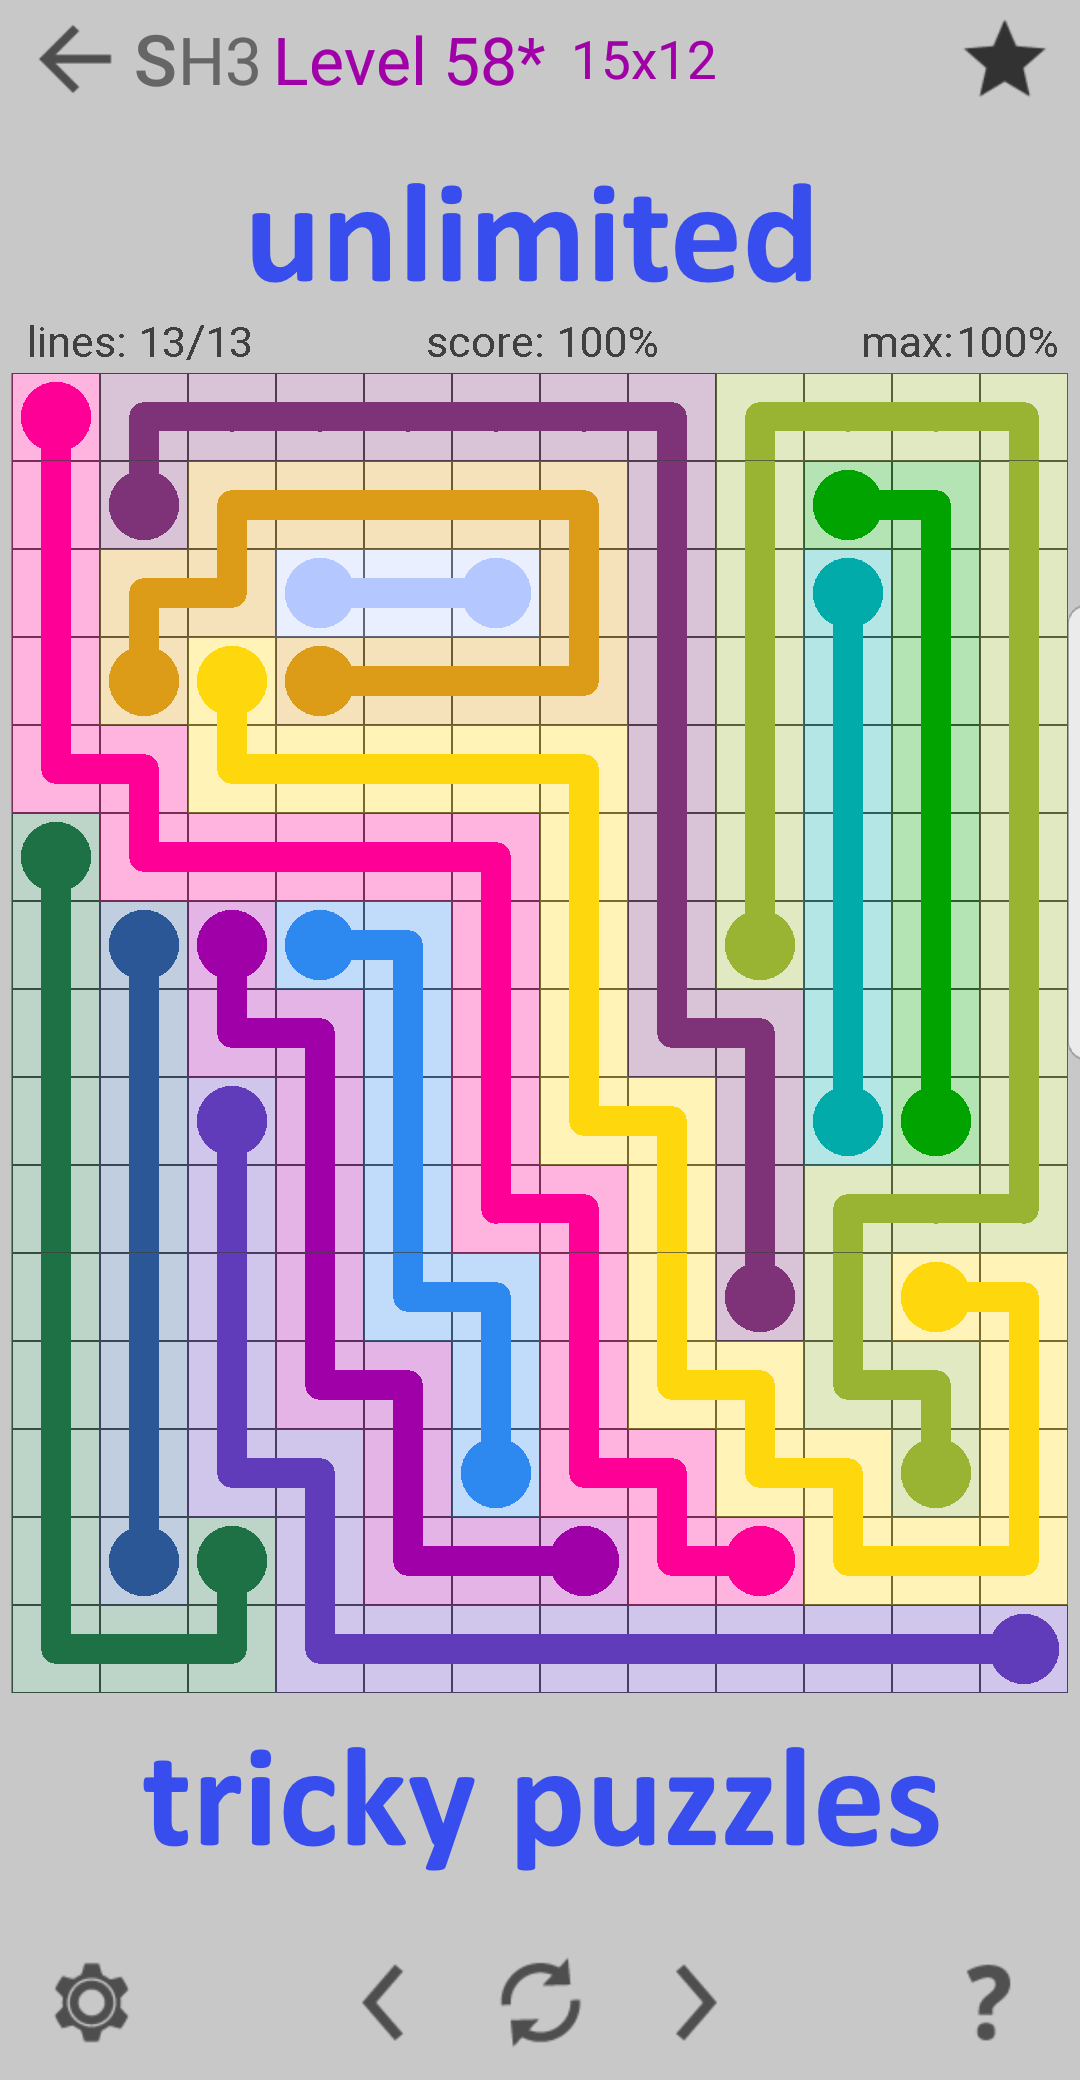
My improved level generator using similarity filtering also works well for the most complex levels of my games. Below are some of the most difficult levels from my last two games.


Subjectively, the levels from CTD: Portals look like puzzles generated by a computer program, while the levels from CU2 look like puzzles composed as a human. Later I went on to quantify this feeling I had of human vs computer generated puzzles. You can read the results of my analysis here: Comparing Levels vs. Flow Free.
There I document how I found that the computer-generated levels for my game Connect Unlimited 2 were indistinguishable from the manually created levels in Flow Free, the original connect-the-dots puzzle game that I played.
It is the interesting patterns in these small puzzles that inspired me to create larger computer generated art.
Computer Generated Line Art
Main page: Computer Generated Line Art
When I used my level generator to create levels larger than those in my games, I found the results so interesting that I focused my development into turning my level generator into an art generator.
The gallery below shows examples of this artwork in roughly chronological order of when they were created. See: Galleries for many more examples.
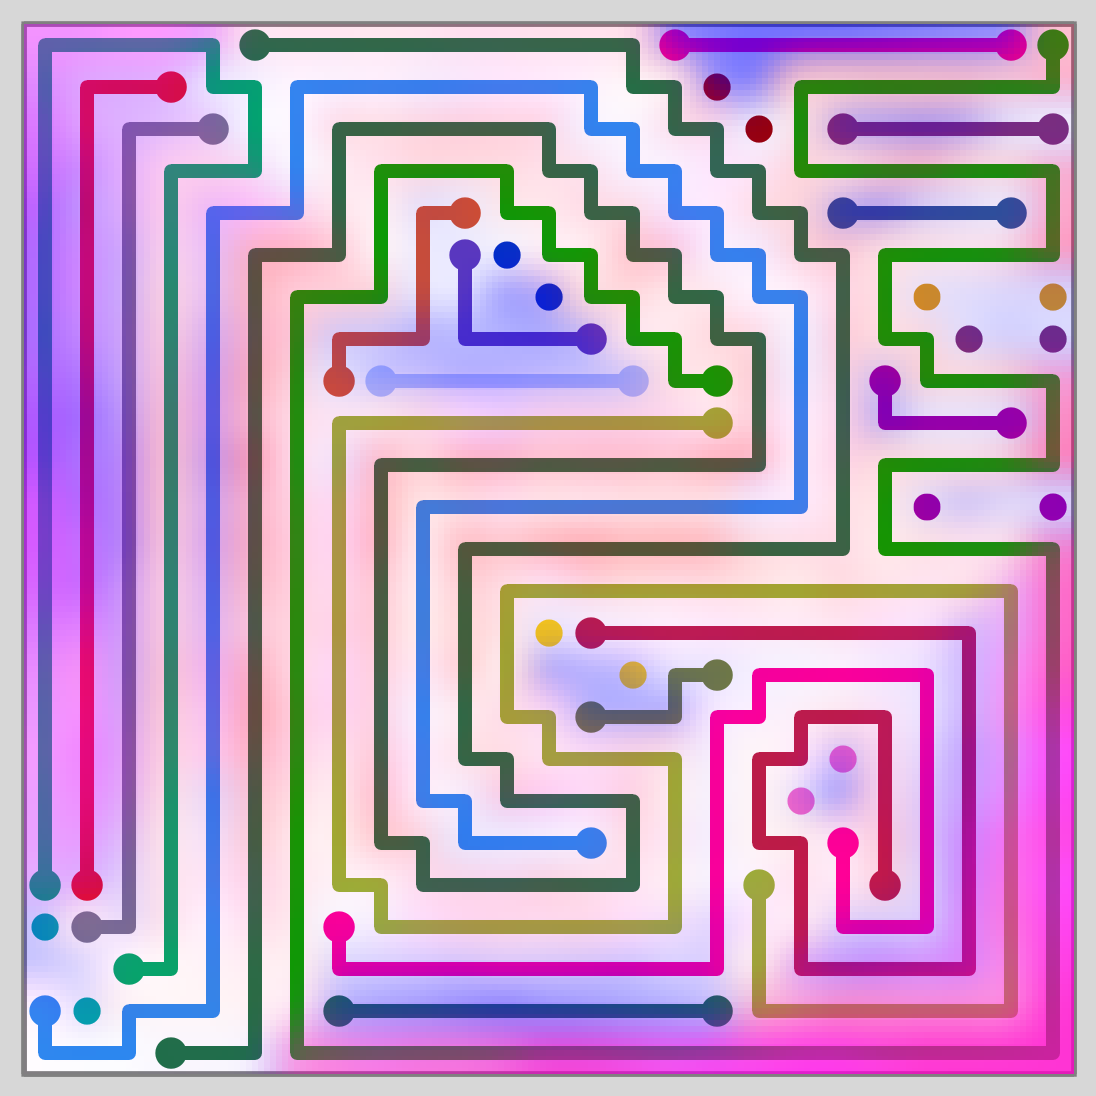
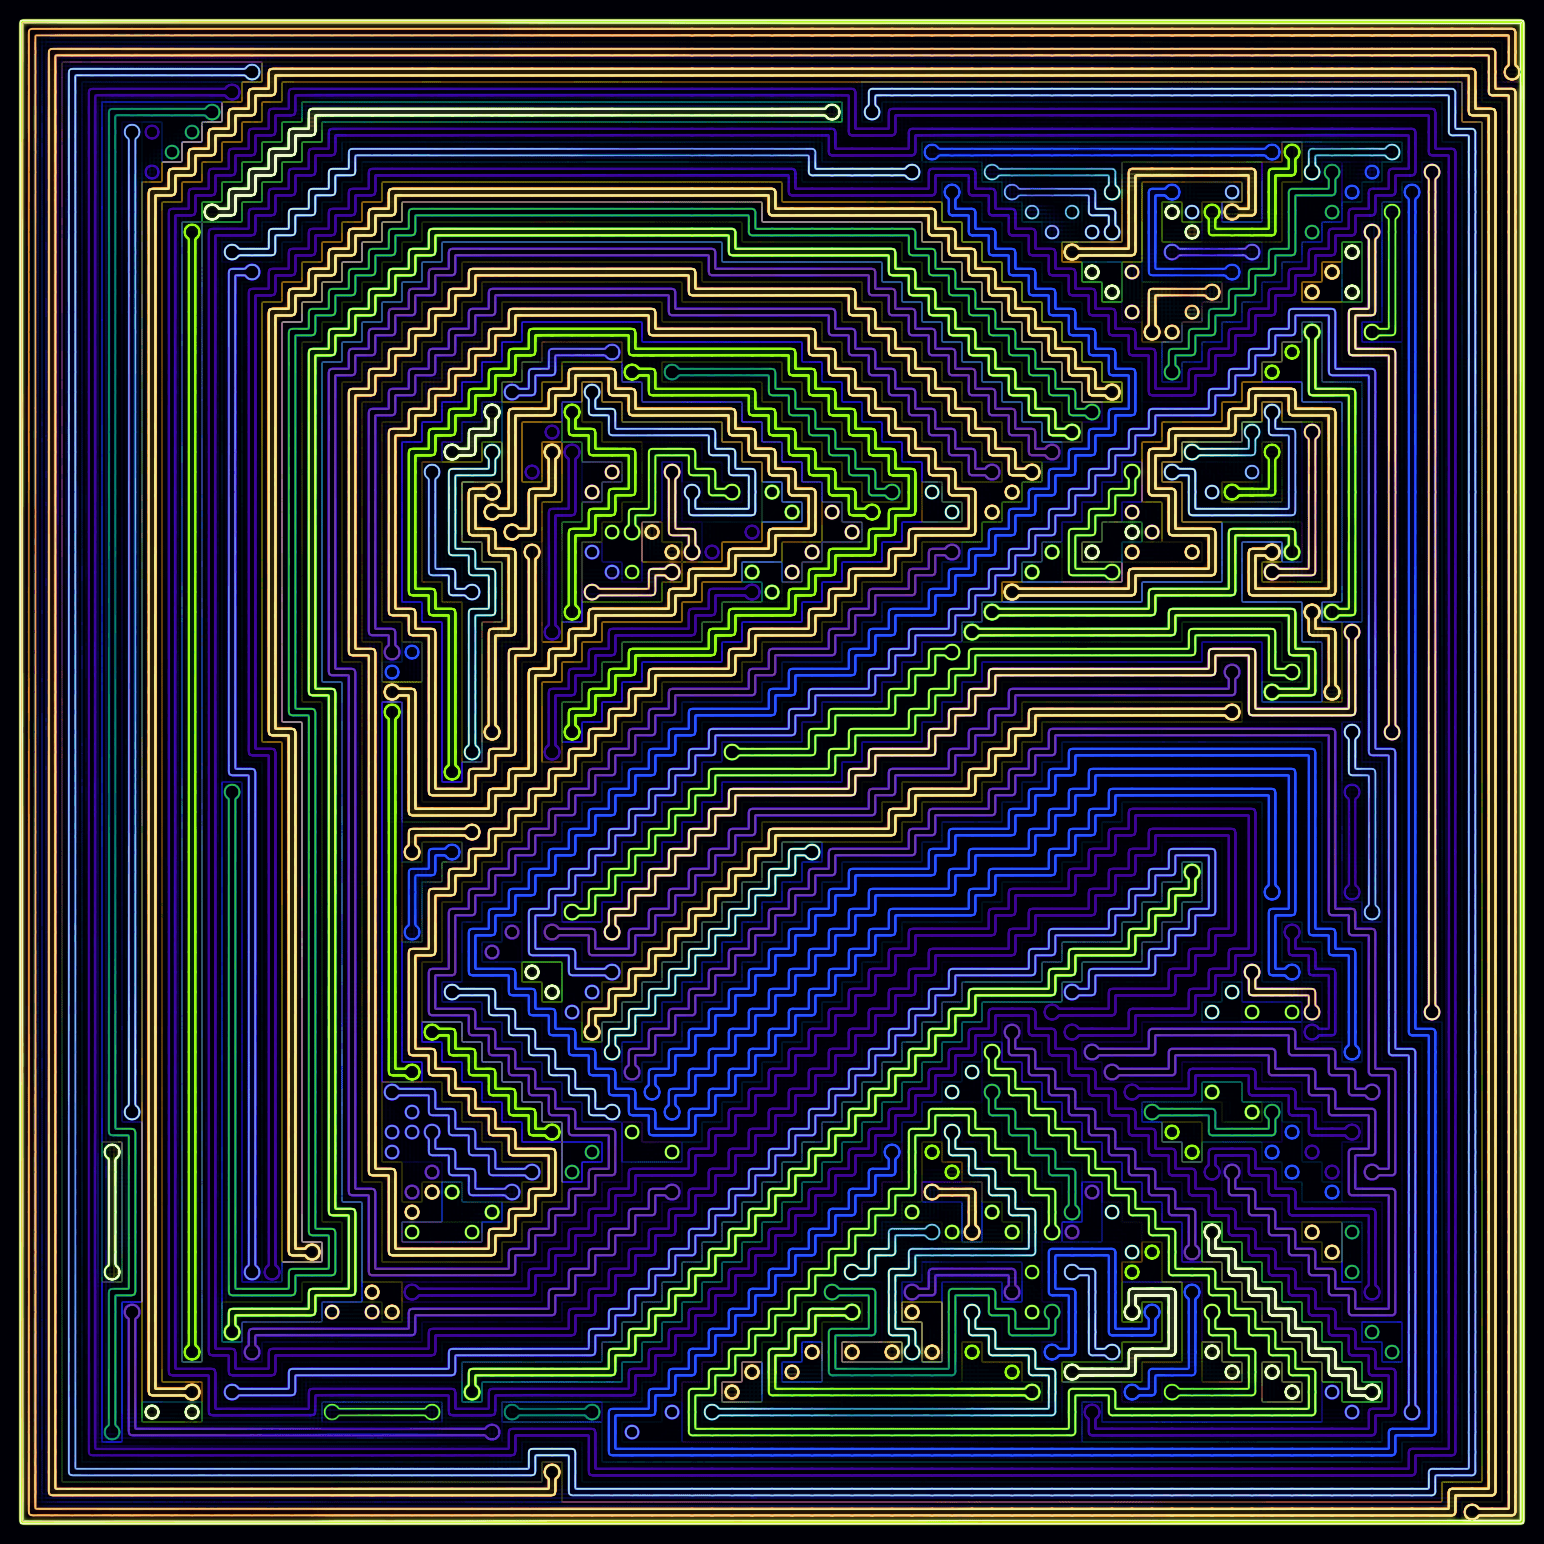
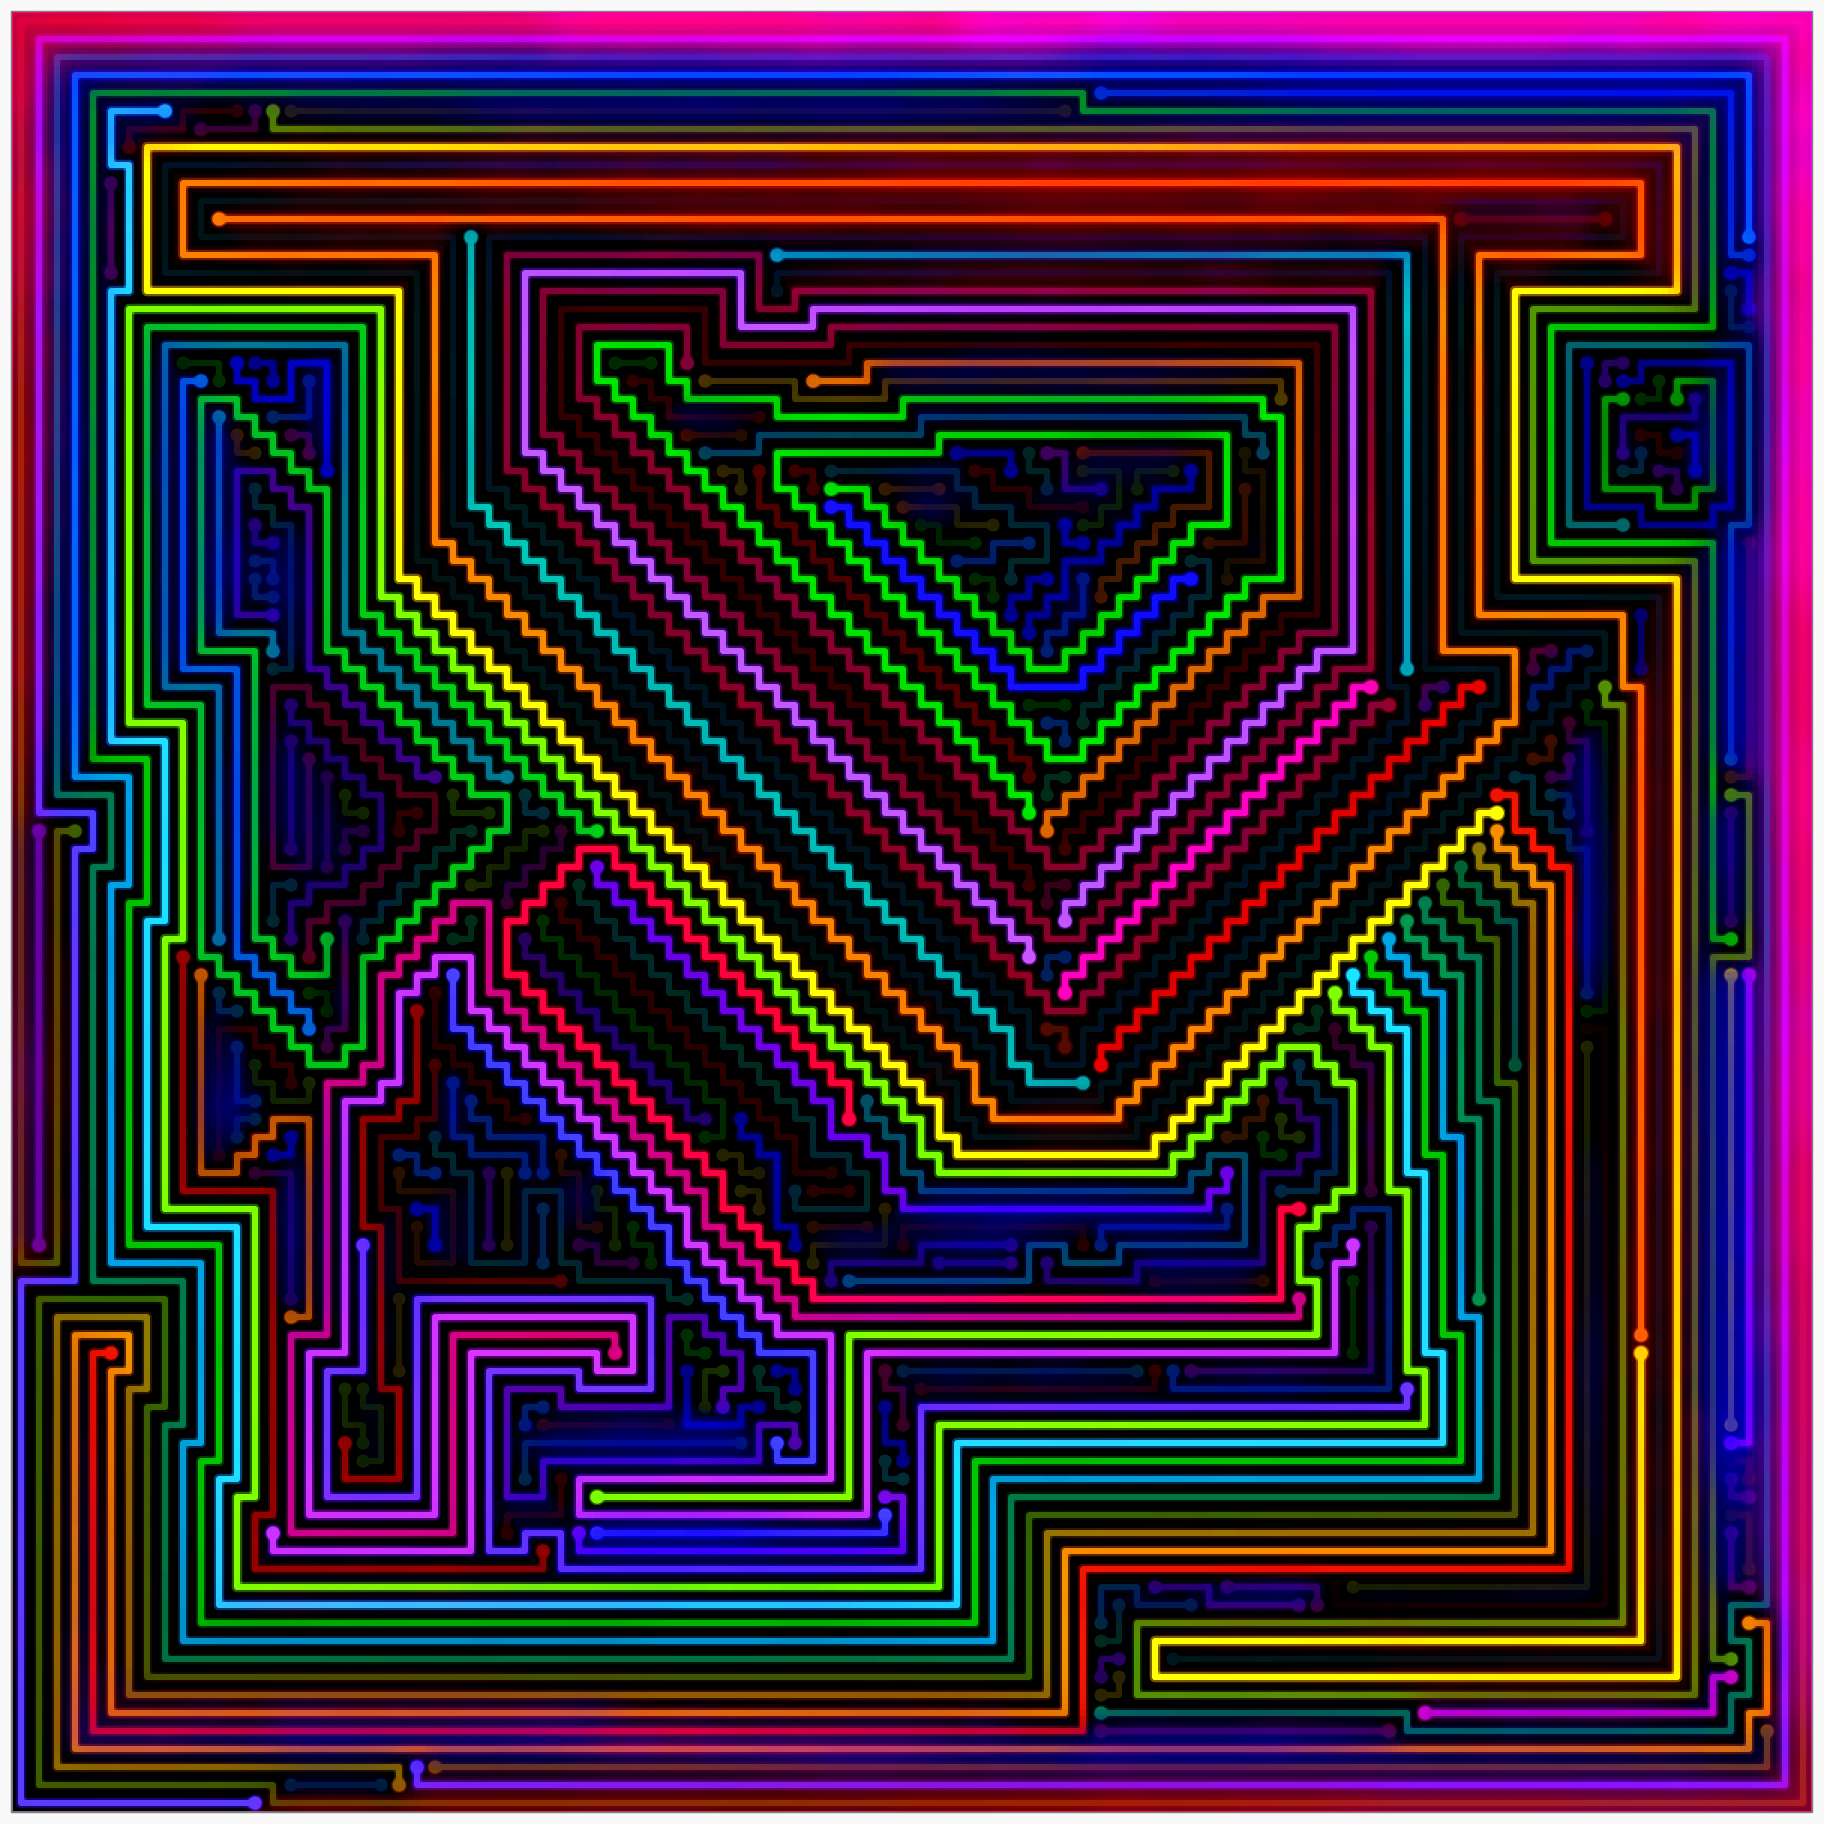
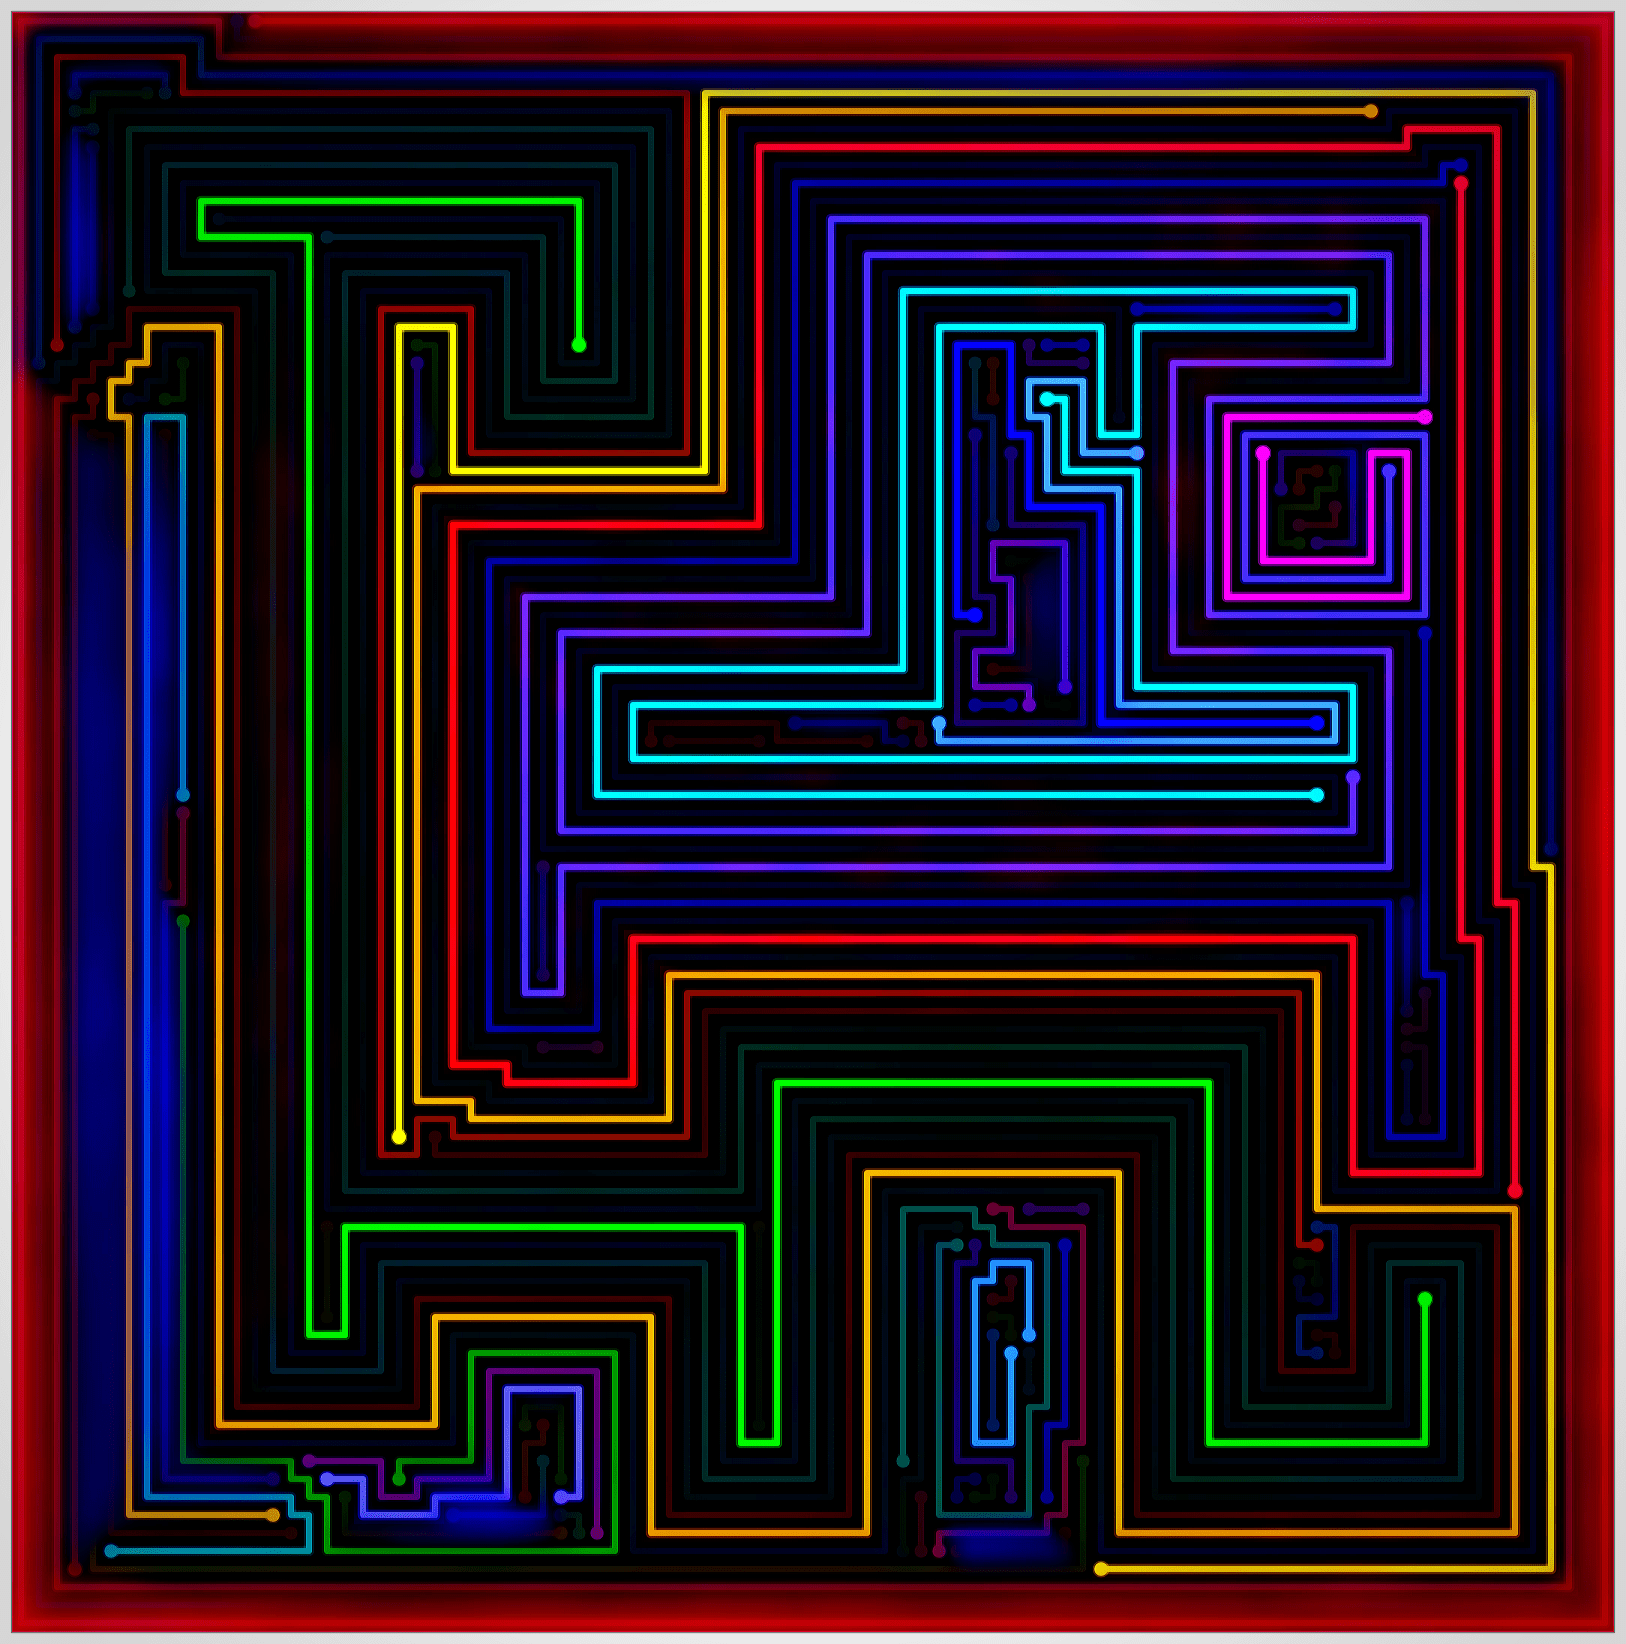


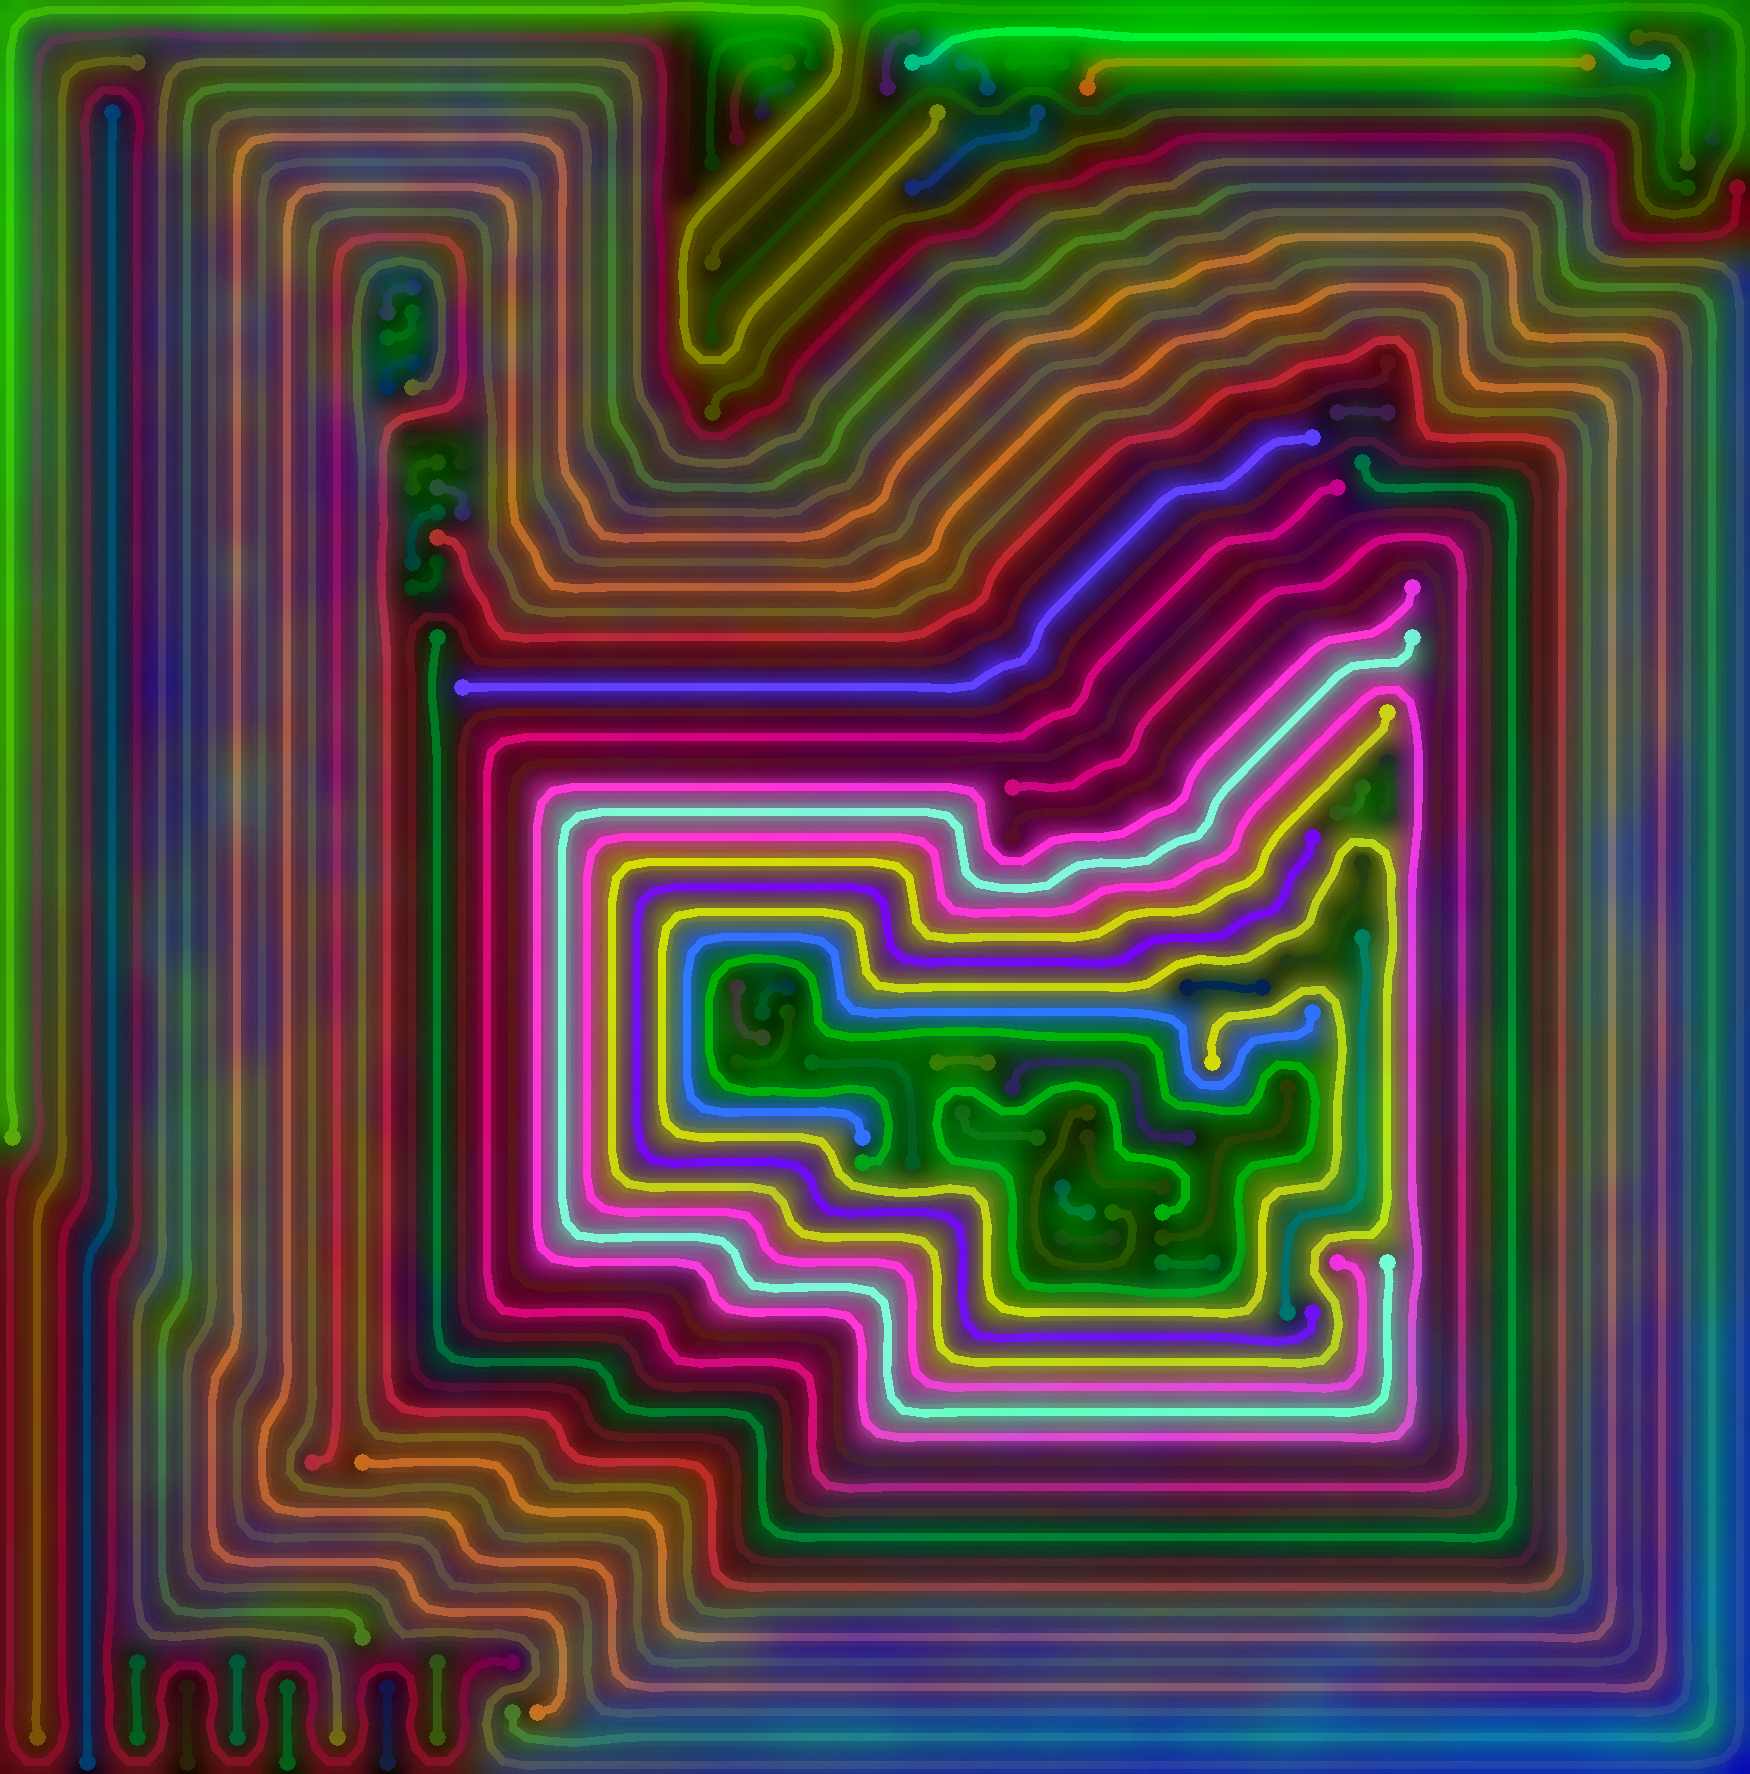
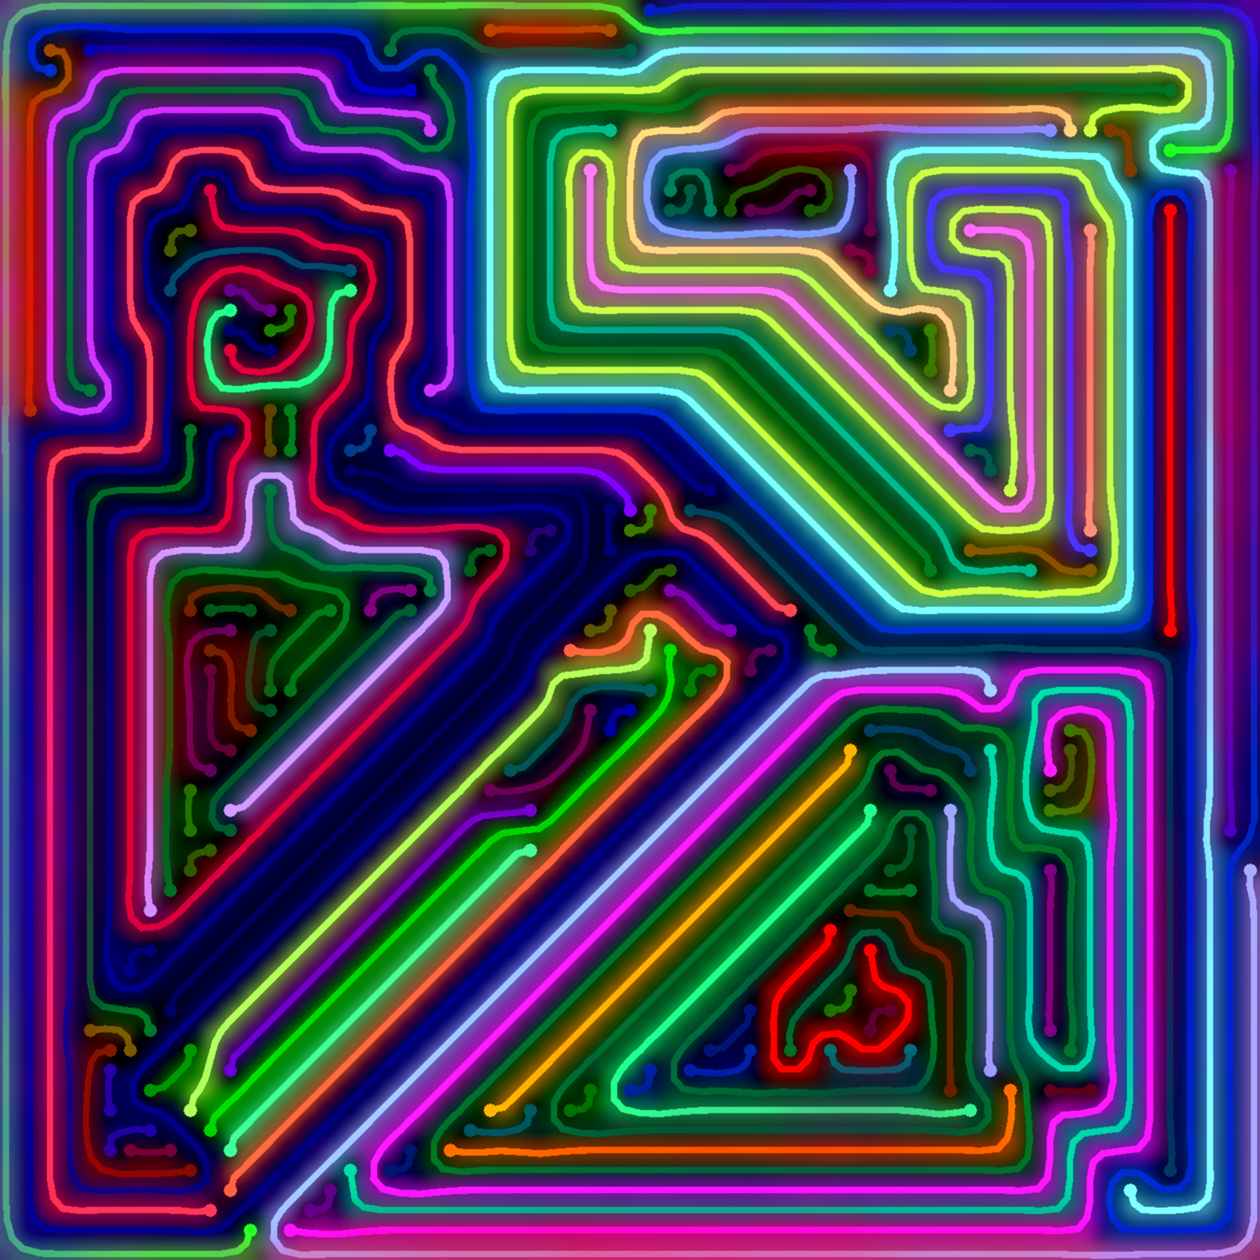

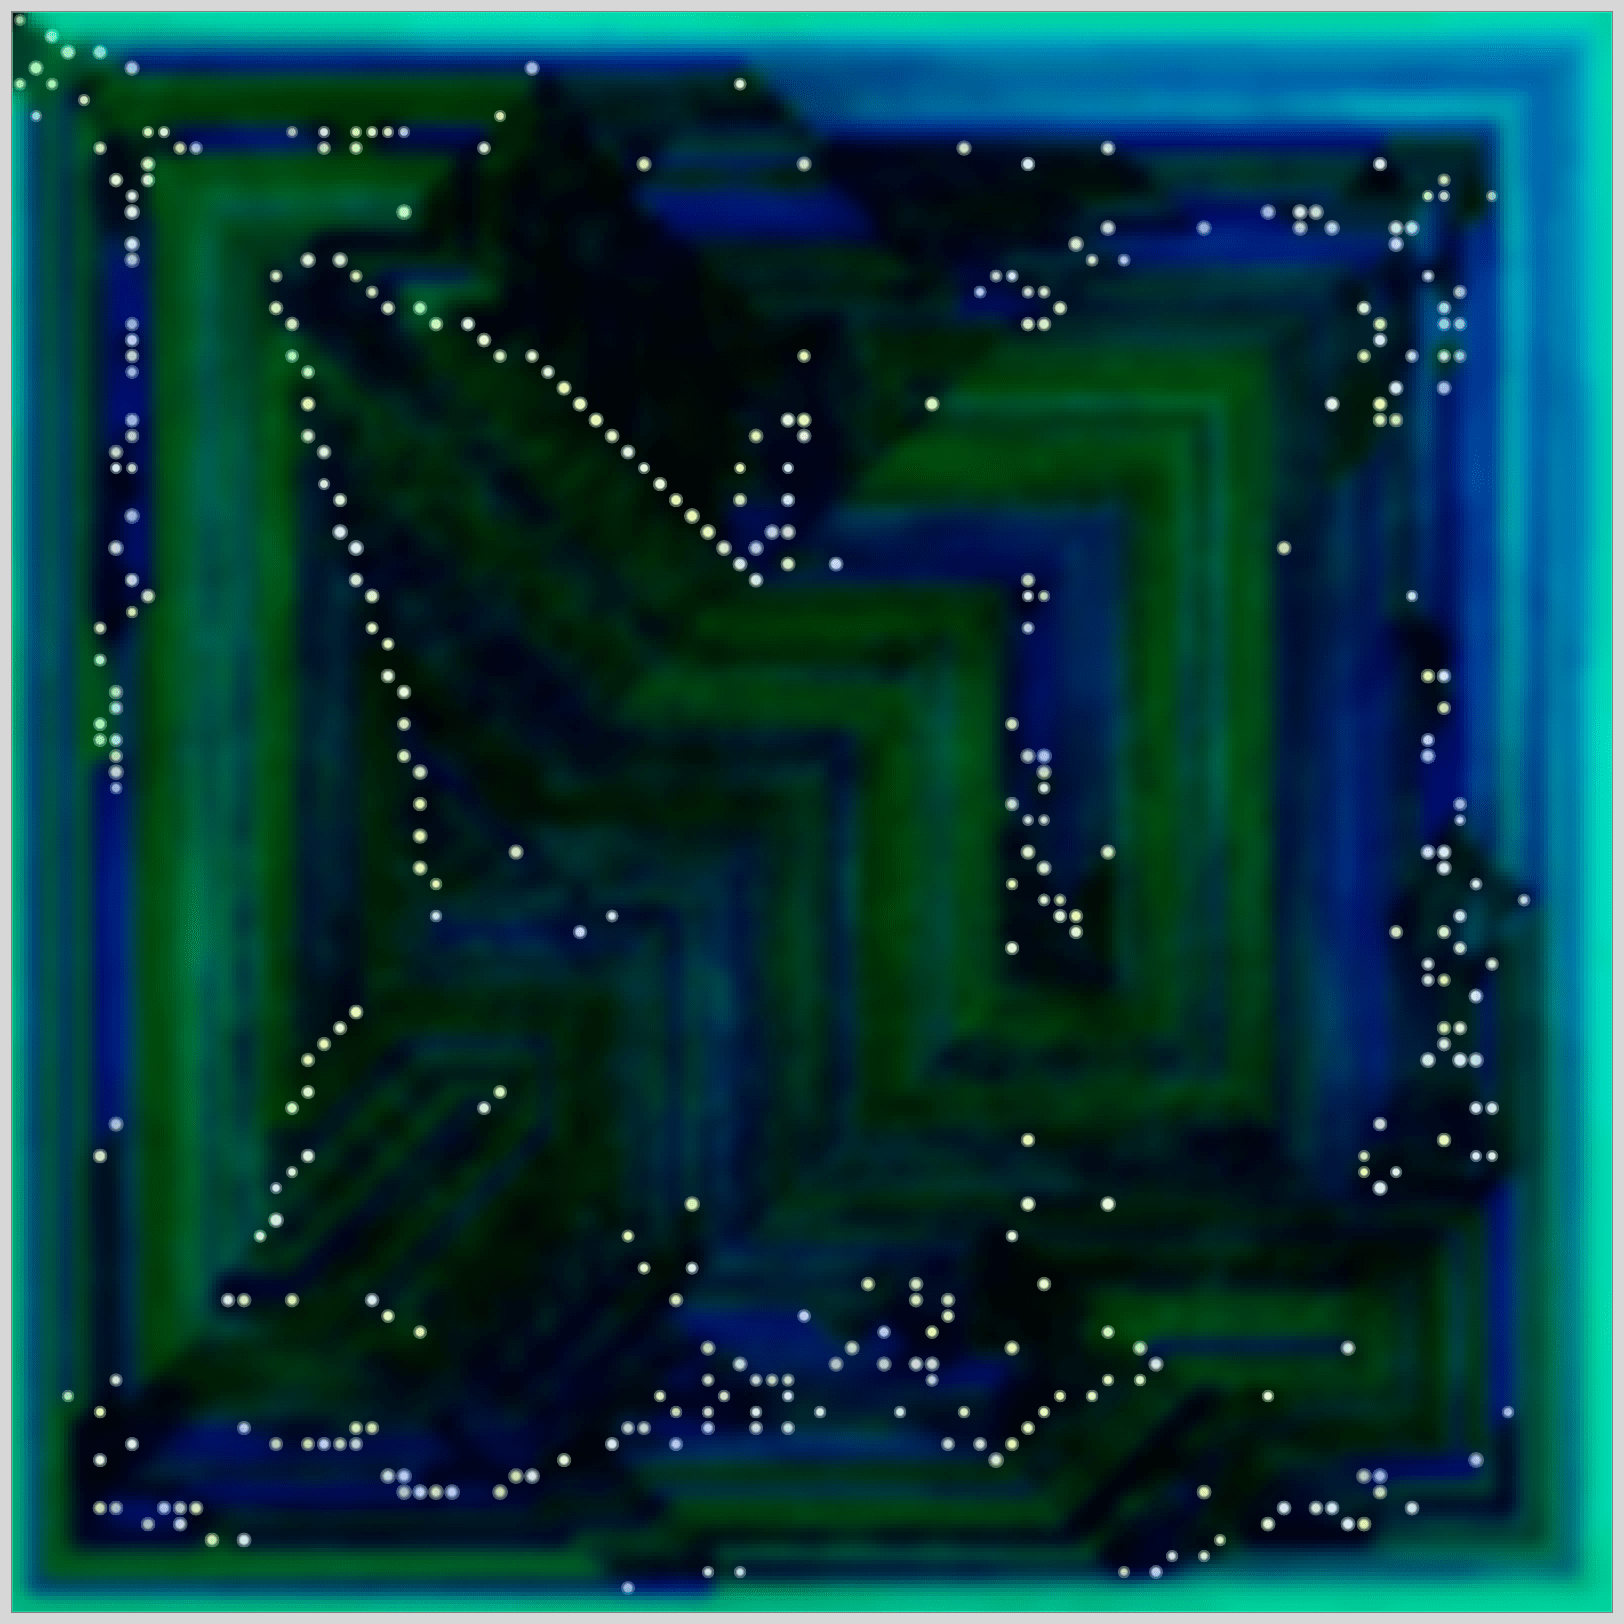
The first five images were created using grid sizes of 25×25, 80×80, 90×90, and 100×100 (third and fifth image). The next three images are from a later phase of this artwork, with smoothed, glowing lines influenced by a gravitational pull. The ninth image features a polygonize effect. The last image, which I call a constellation map, shows only the similarity shading and the endpoints of each line, but not the actual lines. The colors of the lines were originally randomly chosen by my program, though I manually adjusted the colors of several lines for most of this artwork. The background shading is also computer generated, and based on Similarity Maps.
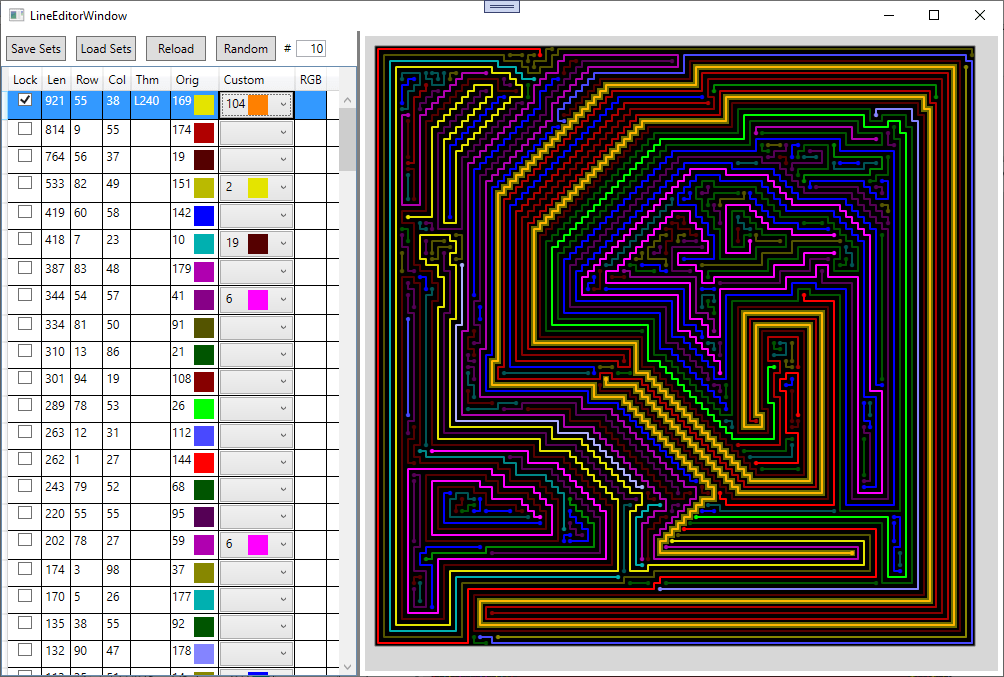
Behind the creation of this artwork is a distributed processing application that required thousands of hours of processing time to create the grids for some of the galleries on my website. I also designed an extensive GUI for creating and editing the images. Here is an example of the user interface I created to edit the color of lines:
Color Grids
Main page: Color Grids.
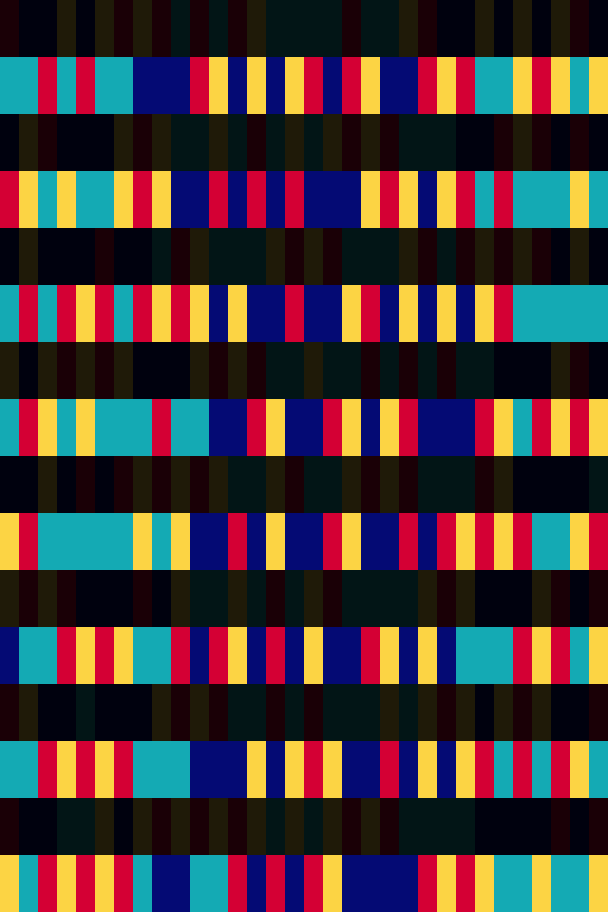
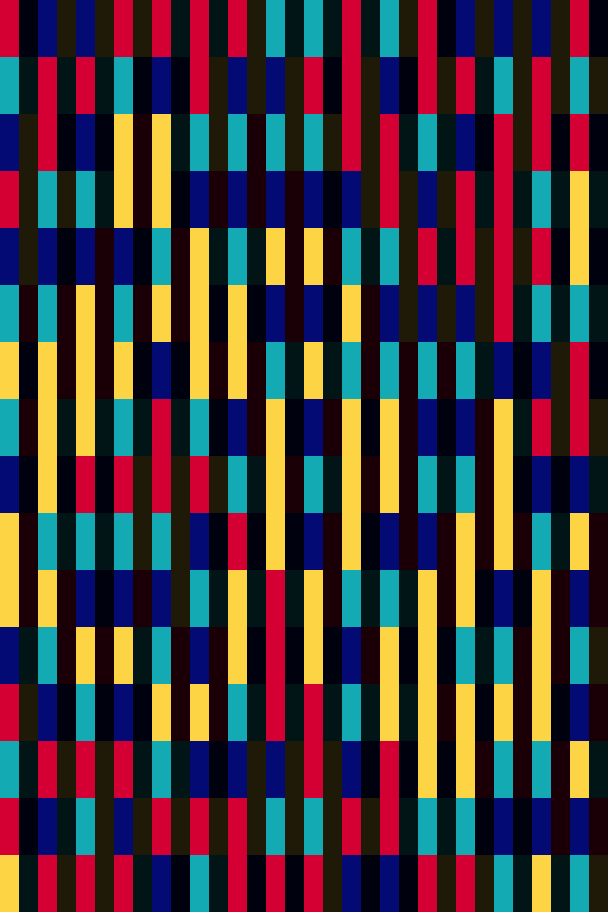
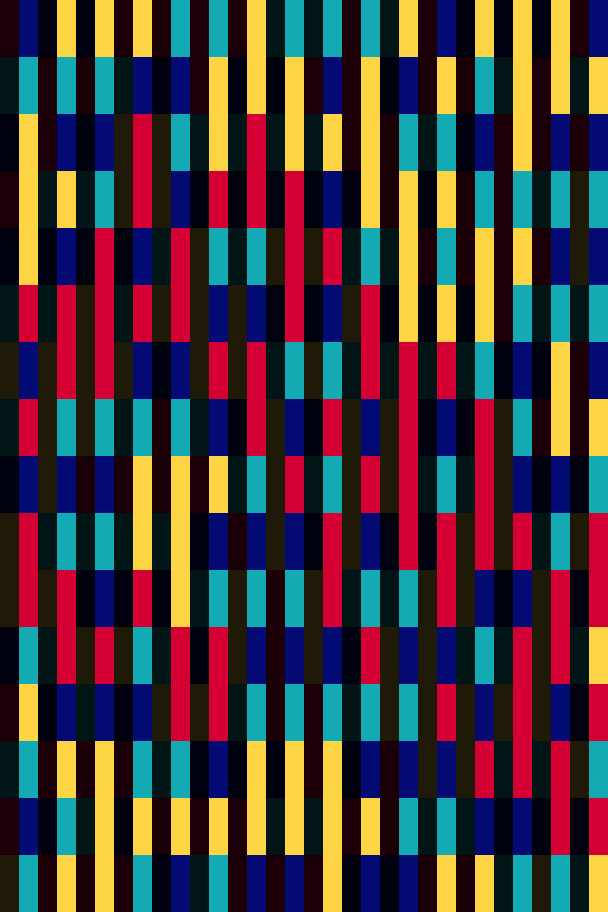
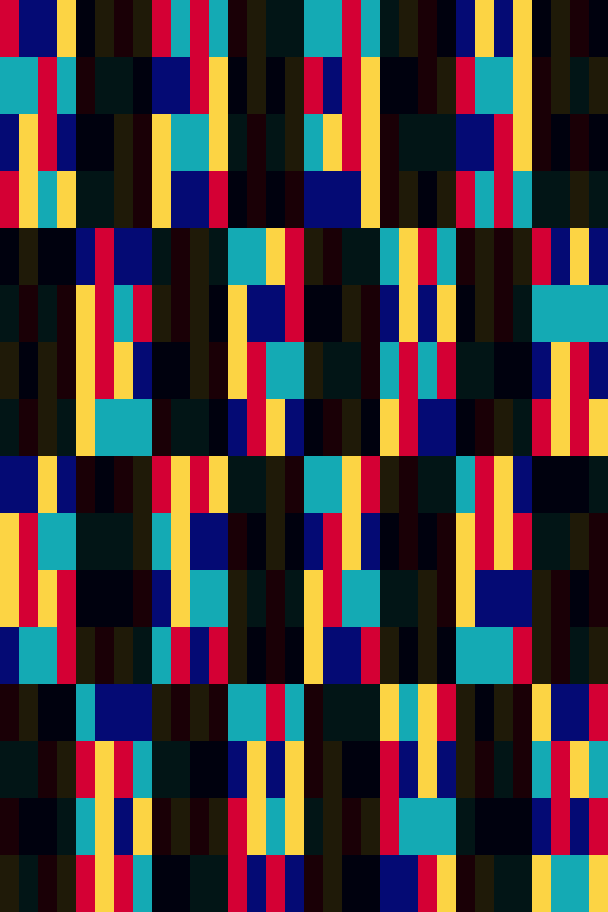
Color grids are another type of computer generated art that I have created. For this work I have written a program that fills in a grid with colors according to a customizable set of rules. The following example is featured on the page Solving a Hard Problem, with slightly different colors.

The grid shown has 16 rows and 32 columns with cells three times as tall as they are wide. The colors are evenly distributed in 88 groups of cells, each of which is shown in the gallery below. For example, the first four images show that there are 8 of each color in each of the 16 rows, and 4 of each color in each of the 32 columns.

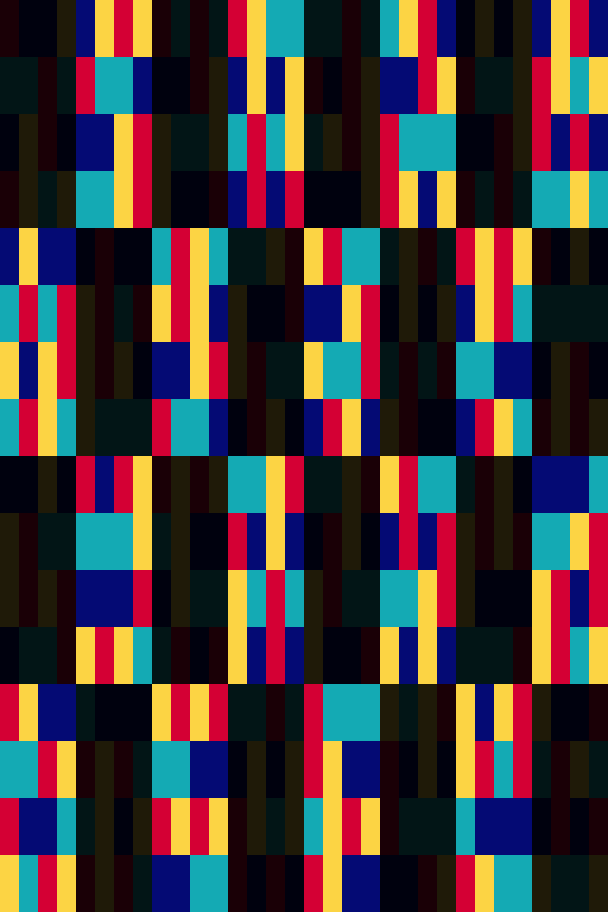
In addition to the distribution sets, the colors in the grid also adhere to the following adjacency restrictions:
- The cells to the top left, top right, bottom left, and bottom right of a cell cannot be the same color as that cell.
- The cells to the left or the right of a red or yellow cell cannot be the same color as that cell.
- The cells above and below a blue or purple cell cannot be the same color as that cell.
Of the 8 cells surrounding each cell, only 2 of the 8 cells can be of the same color:

The adjacency and distribution rules both restrict the number of colors available for each cell as the program fills out the grid. Of the many rule sets I tested, this rule set has among the most restrictive rules of both types. The combination of rules makes it really easy to run out of valid colors for a cell, which I call a color conflict. The graph below shows that these conflicts were especially common during the last 100 cells filled in by my program:

The chart shows that my program frequently had to erase 50 or more cells on its path towards reaching this solution. My program was actually lucky it needed only 12,000 moves to create this grid; for another solution that shares the same first 256 cell/colors as this one, it took a full 5 billion moves before it finally reached a different, but also valid, solution.
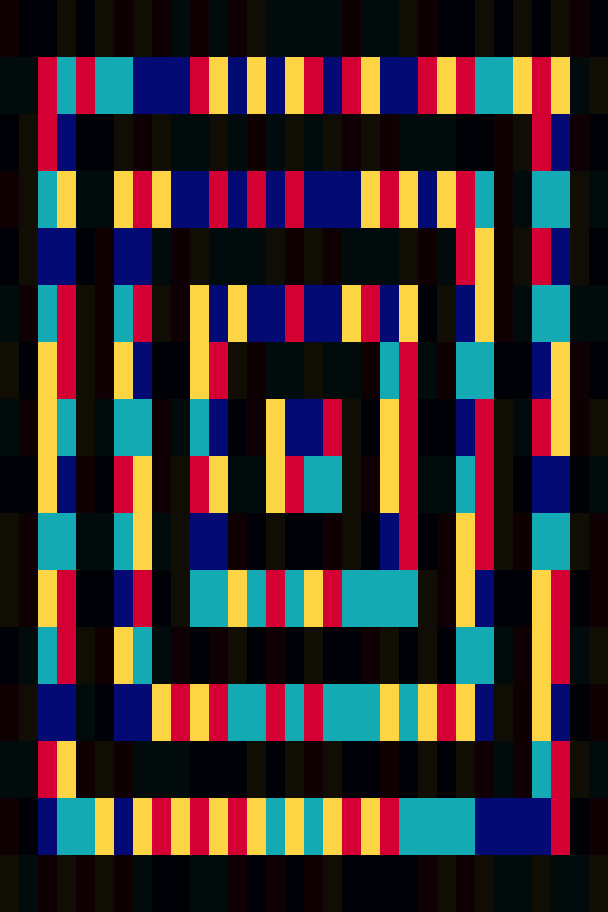
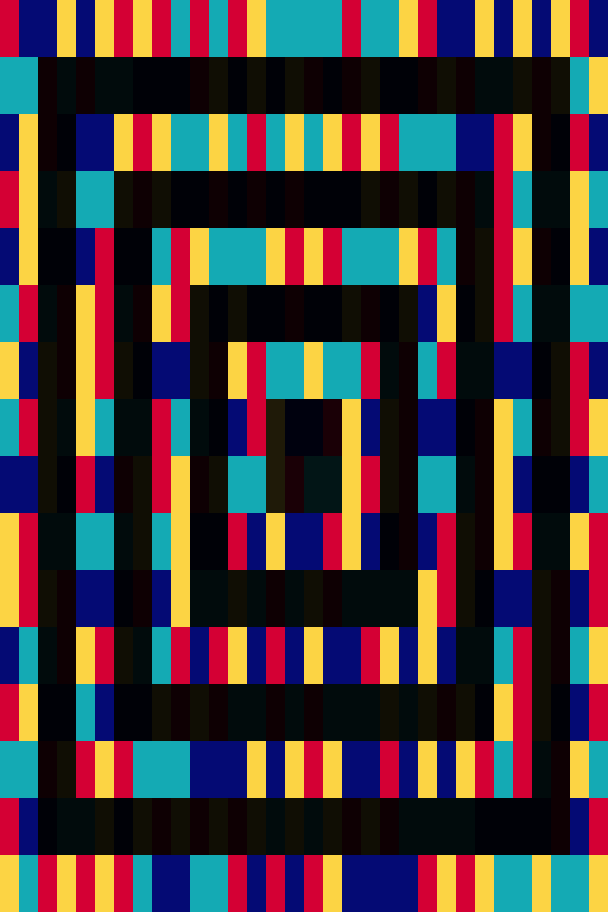
Beginning at cell 458, the program was forced to pick a single color for a stretch of 48 consecutive cells. The odds of it making it through this stretch without a color conflict were less than 1 in 50,000. The following image is from after it had filled in 478 cells:

The program had just filled 10 cells (outlined in green) that had just one valid color, 8 with red and 2 with yellow. Every assignment of a color to a cell eliminates that color from other cells, so the program was very lucky that the 8 red cells didn’t cause a color conflict. After these 10 forced color assignments, the 9 black cells with the magenta border had only one available color.
See: Solving a Hard Problem for more details about the creation of this particular grid.
This grid is an example of just one of the many rule sets that my program solved. For more general information, see my page on Grid Generation, which uses flow charts to explain the process my program uses to create these grids.
The Solution to Darts?
Main page: The Solution to Darts?
This is an example of a problem that I did not quit thinking about until it was solved.
When I was a child, my father and I played darts against each other in fantasy dart leagues with fictional teams and players. Darts also served as my introduction to programming, beginning with Lotus 1-2-3 macros that I wrote to automate record-keeping for these leagues.
As a kid, I always wondered where I should aim my darts to maximize my chances of winning the game. Over twenty years later, I decided to answer this question.
For Part 1 of this project, I demonstrate a mathematical solution to several target optimization problems of increasing complexity for the game of darts. For Part 2, I tracked over 30,000 of my dart throws to test and adapt the mathematical solution for an actual human darts player.
The mathematical solution for Part 1 is dependent on a model of a player’s dart throwing. A bivariate normal distribution (the bell curve with two variables, for a dart’s x and y coordinates) can be used for this model, which is also a reasonable approximation of a human’s dart throwing:

Starting with the simplest target optimization problem of maximizing expected score, this model can be used to predict a dart player’s expected score while aiming at each target on the dartboard. We can then sweep the dartboard to produce a “heatmap” that shows the player’s relative scoring average while aiming at every target on the dartboard:

The key to finding the target that maximizes win percentage, as opposed to score, is to map every score on the dartboard to a win percentage. Calculating this win percentage depends on the rules of the game, and in most situations requires a model and strategy for the opposing darts player. Assuming perfect information, a complete win optimization strategy for the simple Hi-Score variant of darts can be built by mapping the scores to win percentages and then sweeping the dartboard for each of about 5000 situations. An optimal strategy for the more complex 501 variant played in today’s competitive darts requires millions of times the calculations as maximizing score. See: A Mathematical Solution to Darts for details about the algorithms used to calculate these optimal strategies.
While Part 1 effectively solves the game of darts for a computer simulation, my goal was to solve it for a human being, whose dart throwing is unlikely to be accurately represented by a single model that looks like a perfect circle.
My original plan was to build a statistical model of my dart throwing that could be substituted for the formulas used to simulate dart throws in Part 1. I changed this plan because after tracking 30,000 of my dart throws, it became apparent that my mathematical solution, using any statistical model, could not significantly improve my darts game. As a human, my dart throwing isn’t the same while aiming at every target on the dartboard, and as a human, I can’t aim at every specific point on the dartboard that the solution suggests without a visual cue.
However, I did notice that while aiming at the small circular bullseye in the center of the board, my dart throwing was significantly more accurate and circular in distribution, like a computer program’s:


My scoring average would increase by about 6% if I could throw as accurately at the other three targets as I did while aiming at the bullseye.
This gave me the idea for a pair of dartboard targeting goggles that would recognize the dartboard and overlay a visually optimized, possibly circular target based on the situation of the game and a (now useful) statistical model of my dart throwing. These goggles would allow me to aim at the precise points on the dartboard that the mathematical solution recommends. More importantly, by optimizing the shape of the visual target, these goggles could improve the accuracy of my dart throwing and could be adapted to improve my targeting and accuracy for other aim and throw or shoot activities.

In the end, it took me over 30,000 dart throws to realize that this silly idea I had for “dartboard goggles” after just 500 throws is actually a far better solution to darts for a human than any amount of statistical modeling could be on its own. But the solution really came from something I suspected as a kid playing darts with my father: that a human doesn’t see the dartboard the same way that a computer program does. And for a human, the solution to darts is to see the dartboard more like a computer program.
Interested in having me solve problems for your company? Contact me at DougO1081@gmail.com.
![]()
![]()
![]()
![]()
![]()
![]()
![]()