Color grids are the second type of grid-based computer generated art that I have created, after Computer Generated Line Art. For this work I have written a program that fills in a grid with colors according to a customizable set of rules.
An Interactive Viewer
Go here: http://doug-osborne.com/ColorSystems.html to see hundreds of grids following dozens of rule sets. The interactive viewer also allows you to choose your own colors.
Additional Pages
The Basics – The basics behind creating a color grid.
Grid Generation – A detailed description that uses flow charts to explain the process that my program uses to create these grids
Solved – Various rule sets that were solved by my program.
Solving a Hard Problem – One of the hardest rule sets solved by my program, featured at the top of this page.
XO – An interesting variation of the “Solving a Hard Problem” rule set.
An Example
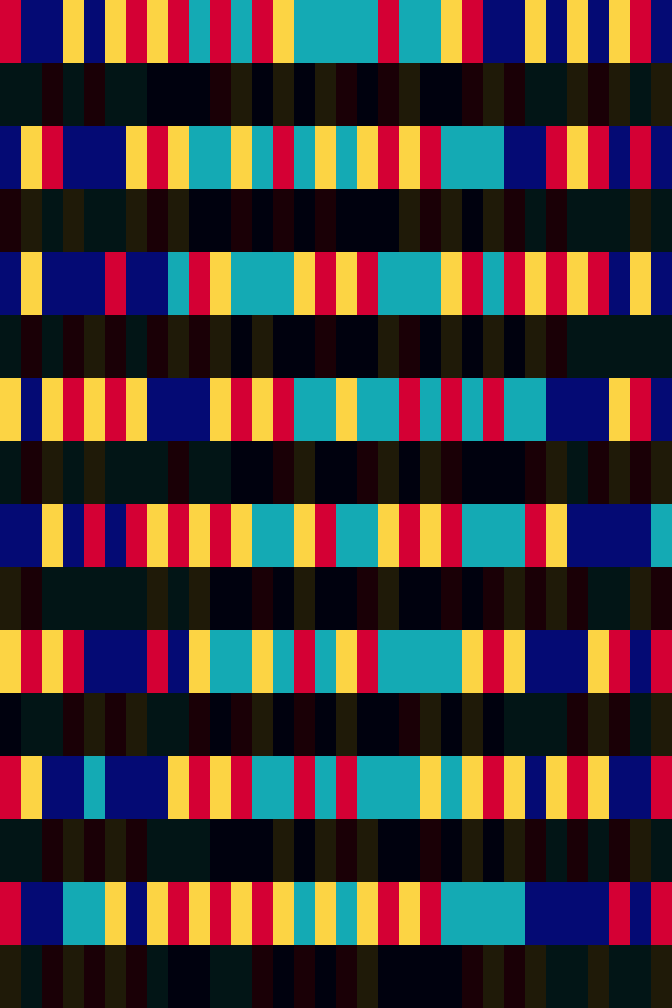
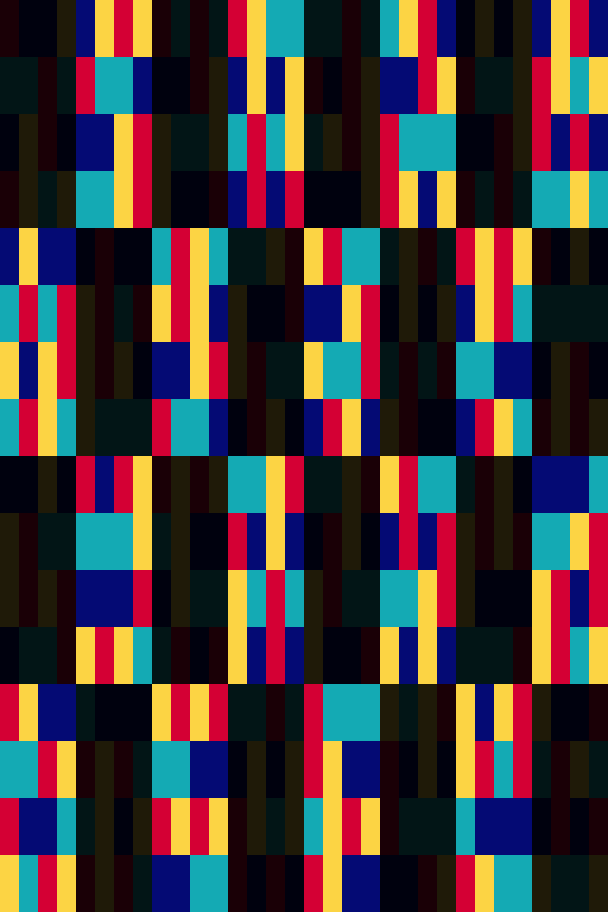
The following example is featured on the page Solving a Hard Problem, with slightly different colors.

The featured grid from the page Solving a Hard Problem, shown with different colors. See this on the interactive viewer, where you can choose your own colors.
The grid shown has 16 rows and 32 columns with cells three times as tall as they are wide. The colors are evenly distributed in 88 groups of cells, each of which is shown in the gallery below. For example, the first four images show that there are 8 of each color in each of the 16 rows, and 4 of each color in each of the 32 columns.
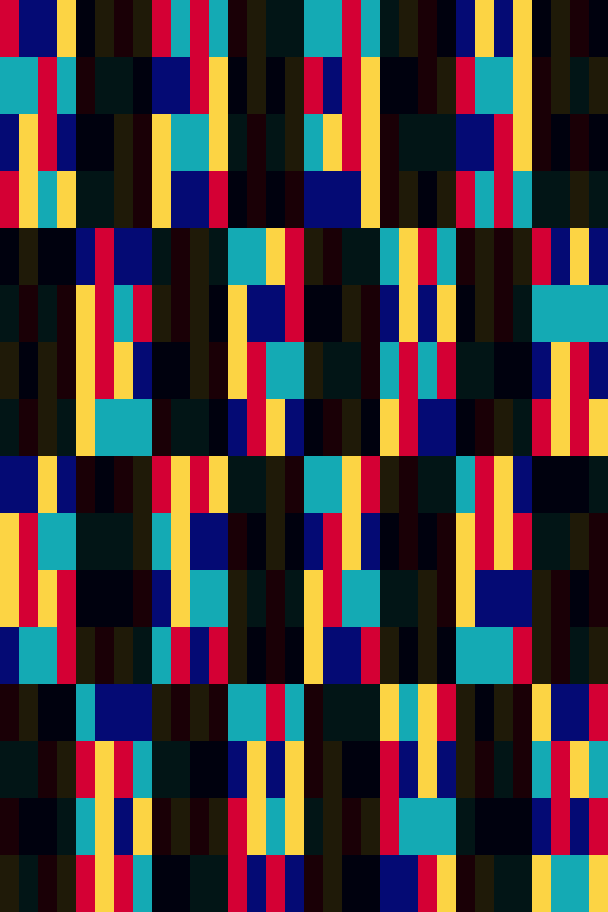
In addition to the distribution sets, the colors in the grid also adhere to the following adjacency restrictions:
- The cells to the top left, top right, bottom left, and bottom right of a cell cannot be the same color as that cell.
- The cells to the left or the right of a red or yellow cell cannot be the same color as that cell.
- The cells above and below a blue or purple cell cannot be the same color as that cell.
Of the 8 cells surrounding each cell, only 2 of the 8 cells can be of the same color:

The assignment of a color to a cell eliminates that color from 6 of the 8 cells surrounding it.
The adjacency and distribution rules both restrict the number of colors available for each cell as the program fills out the grid. Of the many rule sets I tested, this rule set has among the most restrictive rules of both types. The combination of rules makes it really easy to run out of valid colors for a cell, which I call a color conflict. The graph below shows that these conflicts were especially common during the last 100 cells filled in by my program:

When creating this grid, my program picked a color for a cell 12,000 times, of which only 512 of these were “correct.”
The chart shows that my program frequently had to erase 50 or more cells on its path towards reaching this solution. My program was actually lucky it needed only 12,000 moves to create this grid; for another solution that shares the same first 256 cell/colors as this one, it took a full 5 billion moves before it finally reached a different, but also valid, solution.
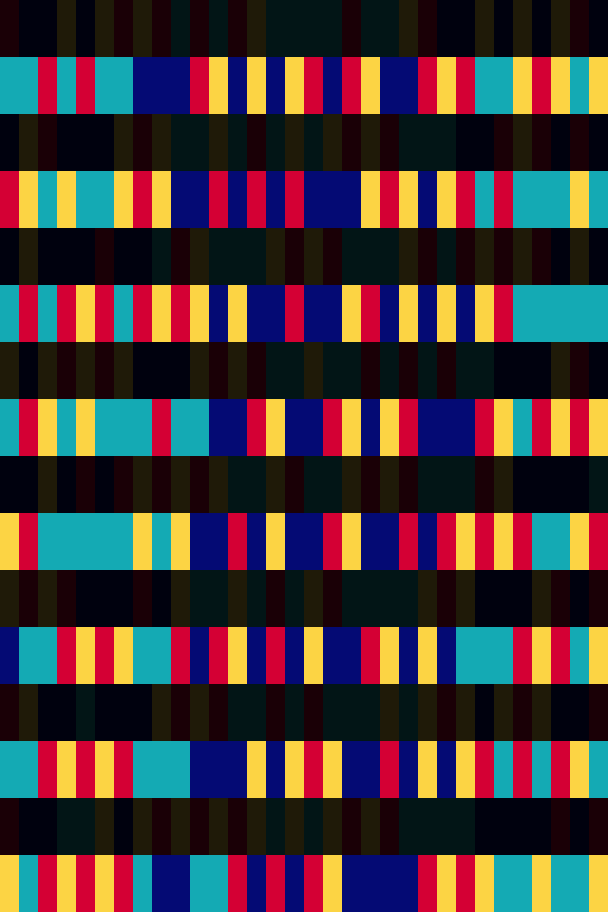
Beginning at cell 458, the program was forced to pick a single color for a stretch of 48 consecutive cells. The odds of it making it through this stretch without a color conflict were less than 1 in 50,000. The following image is from after it had filled in 478 cells:

An image from the page Solving a Hard Problem > The Program vs. The Grid
The program had just filled 10 cells (outlined in green) that had just one valid color, 8 with red and 2 with yellow. Every assignment of a color to a cell eliminates that color from other cells, so the program was very lucky that the 8 red cells didn’t cause a color conflict. After these 10 forced color assignments, the 9 black cells with the magenta border had only one available color.
See: Solving a Hard Problem for many more details about the creation of this particular grid.
This grid is an example of just one of the many rule sets that my program solved. For more general information, see my page on Grid Generation, which uses flow charts to explain the process that my program uses to create these grids. The Interactive Viewer shows many more examples with different rule sets, allowing the user to select colors for each grid.
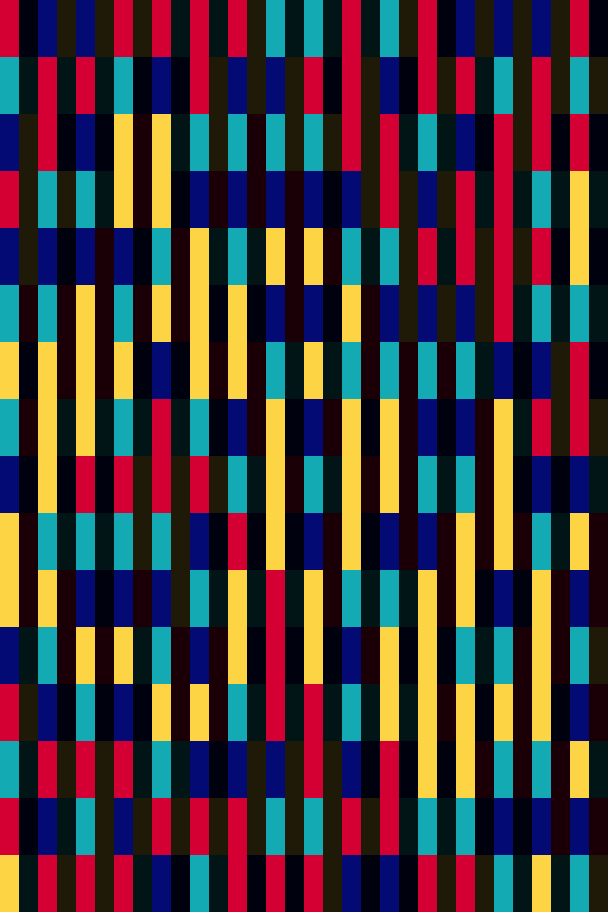
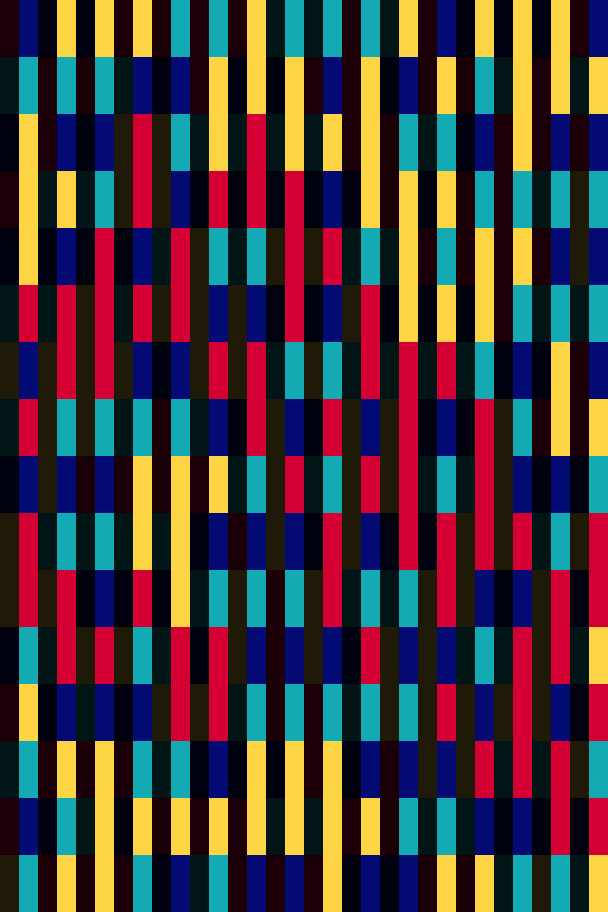
Here are a couple more example grids:

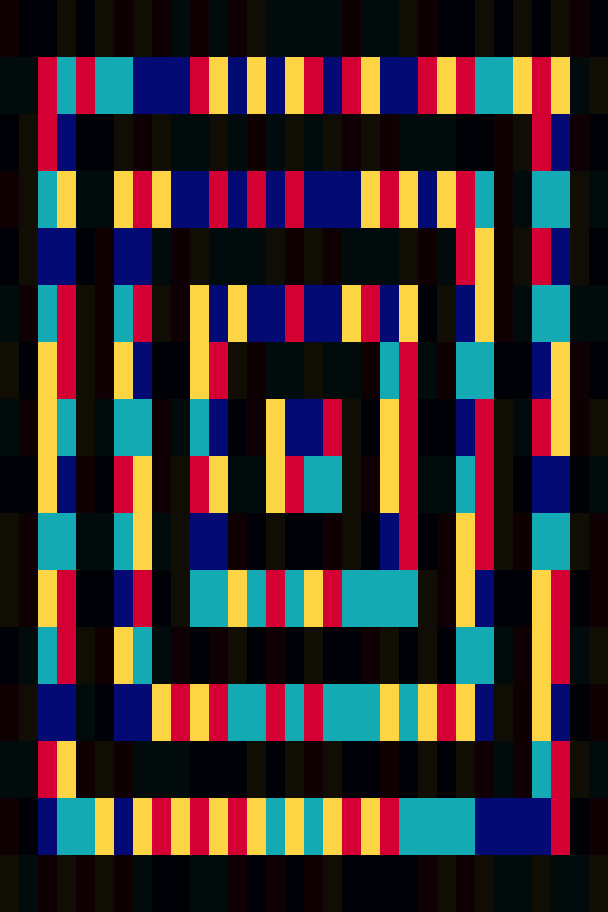
15×35, 5 colors

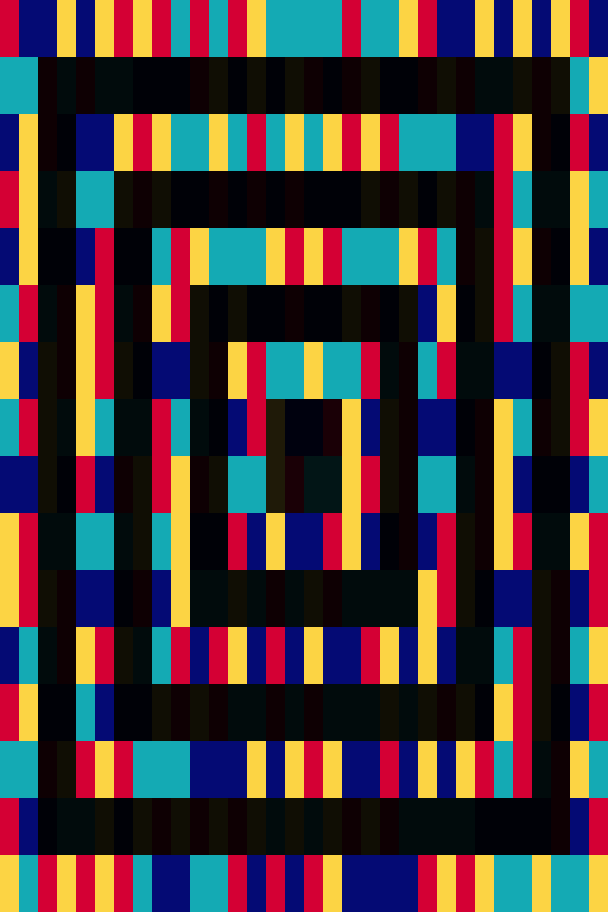
16×36, 4 colors